
Figure 1:
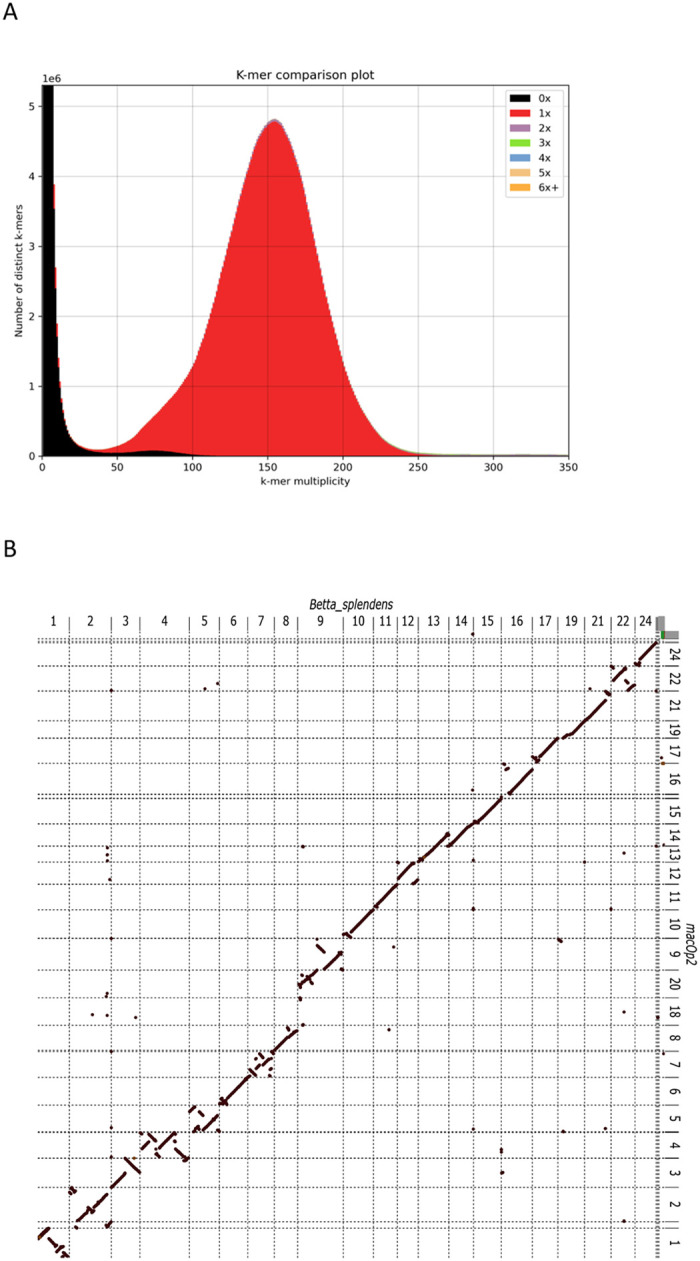

Basic genome assessment. A) K-mer comparison plot. It shows copy number of the k-mers as a stacked histogram colored by the copy numbers found in the paradise fish draft genome assembly. The y-axis shows the number of distinct k-mers, and the x-axis shows the k-mer multiplicity (coverage). Most k-mers are represented once (red peak) indicating high quality for the genomic assembly. B) Whole genome alignment of the B. splendens genome assembly to the M. opercularis assembly. B. splendens is on the X-axis and M. opercularis on the Y-axis. B. splendens chromosomes 4 and 9 appear to map to two separate M. opercularis chromosomes. Chromosome numbering is based on B. splendens alignment to medaka chromosomes [14,20]. C) Distribution of intron sizes for various species of fish showing that M. opercularis is at the extreme low end of the spectrum, similar to puffer fish species. The line denotes the linear regression line fitted over the data. Grey areas denote the 0.95 confidence interval of the fit. The diameter of the circles correlates to the approximate gene count (20 to 50 thousand).