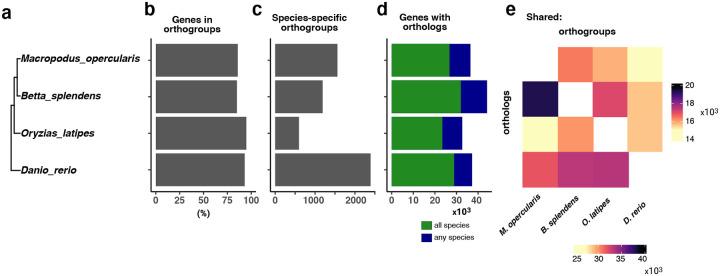
Figure 2:
Comparison of predicted proteins across 4 species. A) Evolutionary relationship between paradise fish, Siamese fighting fish, zebrafish, and Japanese medaka. B) The number of genes per species that could be placed in an orthogroup (the set of genes descended from a single gene in the last common ancestor of all the species). This value is close to 90% for all four species. C) The number of orthogroups that are specific to each species. D) The total number of transcripts with orthologs in at least one other species. E) Heat map of the orthogroups for each species pair (top) and orthologs between each species (bottom).

