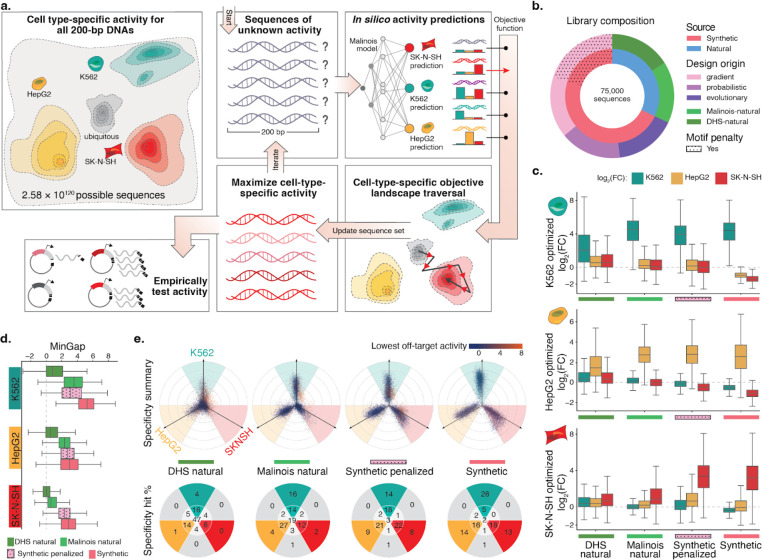
Figure 2. CODA effectively designs novel cell type-specific CREs using Malinois predictions.
(a) CODA designs synthetic elements by iteratively updating sequences to improve predicted function. Cell type-specific CRE activity of all 200 bp DNA oligos induces a topology over a massive sample space. CODA initializes sequences in this space and uses Malinois to predict local topology. An objective function is used by CODA to direct updates of sequences to move as desired through predicted topology. Updated sequences can be further modified in silico until a stopping criteria is reached and final candidates are proposed for experimental validation. (b) Composition of the MPRA library designed to empirically evaluate candidate cell type-specific CREs. A total of 75,000 sequences were selected from the human genome (green hues) or designed ab initio using CODA (purple hues) to maximize the MinGap score for a target cell type. Aggregated natural and synthetic sequences are indicated by blue and coral coloring, respectively. Sequences generated using motif-penalization are delineated by the dotted overlay. (c) Computationally-designed CREs maintain high transcriptional activity in target cells while improving silencing in off-target cells. The three rows of box plots correspond to candidate CREs intended to drive cell type-specific expression in K562, HepG2, and SK-N-SH. Each group of three boxes indicate the distribution of MPRA log2 fold change (log2FC) measurements in K562 (teal), HepG2 (yellow), and SK-N-SH (red) for a set of sequences nominated by the indicated design strategy on the x-axis. Boxes demarcate the 25th, 50th, and 75th percentile values, while whiskers indicate the outermost point with 1.5 times the interquartile range from the edges of the boxes. Sequences with a replicate log2FC standard error greater than 1 in any cell type were not included. (d) CODA-designed synthetic sequences achieve higher overall cell type-specific activity than natural sequences. Box plots display distribution of MinGap scores to quantify cell-specific CRE function and color indicates intended target cell type (K562: teal; HepG2: yellow; SK-N-SH: red). Boxes demarcate the 25th, 50th, and 75th percentile values, while whiskers indicate the outermost point with 1.5 times the interquartile range from the edges of the boxes. Sequences with a replicate log2FC standard error greater than 1 in any cell type were not included. (e) Top row: propeller plots for each sequence group. The radial distance corresponds to the distance between the maximum and minimum cell type activity values, while the angle of deviation from an axis quantifies the relative activity of the highest off-target cell type (Methods). Teal, yellow, and red areas represent sequences in which the MinGap:MaxGap ratio is greater than 0.5. Dot colors are associated with the activity in the minimum off-target cell type. Bottom row: percentages of points in each delimited area rounded to the nearest integer. The point count in the center represents sequences with quasi-uniform activity across cell types, while the gray wedges count sequences with a low MinGap. The groups synthetic and synthetic-penalized were randomly sub-sampled to match the size of the two natural groups (see Supplementary Fig 13 for full plots).

