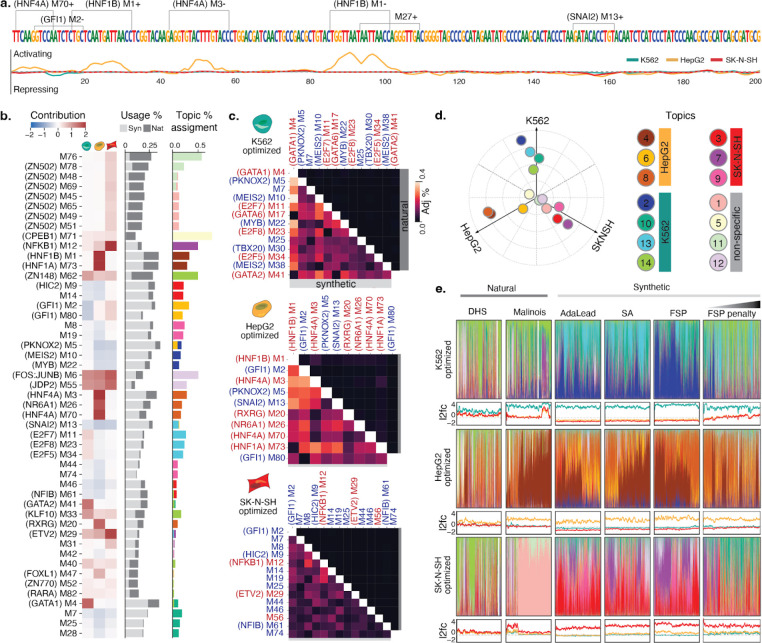
Figure 3. Interpreting CRE syntax in engineered elements.
(a) Malinois contribution scores enable nucleotide resolution interpretation of sequence activity. Shown is a representative synthetic CRE designed to drive HepG2-specific reporter expression. Enriched motifs, demarcated on the upper sequence track, can be combined with model prediction contribution scores, plotted for each cell type on the lower track (K562: teal, HepG2: yellow, SK-N-SH: red), to interrogate and assign functional subunits. Positive and negative values indicate sequences contribute to transcriptional activation or silencing, respectively, in the corresponding cell type. Motifs are labeled with an “M” followed by their STREME output index. Motifs with a strong known-motif match (Methods) have the name of the match in parenthesis preceding their label. “+” and “−” denote forward and reverse orientations respectively. (b) Left heatmap: average contributions of enriched motifs in K562, HepG2, SK-N-SH (left to right columns). Center bar plot: motif enrichment in synthetic (light gray) and natural (dark gray) sequences. The x-axis represents the percentage of sequences in each group that contain at least one instance of that motif denoted on the y-axis. Right bar plot: motif program association derived from the NMF features matrix. Colors correspond to programs listed in Fig 3e. Only motifs with the top-4 assignments for each topic were included in the figure (see Supplementary Fig. 14 for full figure). (c) Cooccurrences of enriched motifs are more prevalent in synthetic CREs. Adjusted co-occurrence percentage is calculated by multiplying (i) the percentage of sequences in each group containing a pair of motifs and (ii) the similarity divergence of the motifs (1 minus the Pearson correlation coefficient of the motif logos in their optimal alignment) (Methods; see Supplementary Fig. 16 for raw percentages.). Upper and lower triangular percentages correspond to natural and synthetic sequences respectively. Red and blue motif labels denote motifs with mostly positive or negative contribution, respectively. (d) Specific functional programs drive cell type-specific transcription. Empirical program function calculated using a weighted average of MPRA log2FC scores based on topic mixture displayed in panel c. Ten cell type specificity-driving programs were identified using the same criteria applied to identify cell type-specific sequences (bright colored points; 4 for K562, 3 for HepG2, 3 for SK-N-SH). Four programs are not associated with cell type-specific transcription (pastel points). (e) Synthetic and natural sequences show distinct patterns of higher order arrangements of TF binding motifs. Colored bar plots generated from NMF decomposition of synthetic and natural sequences based on enriched motif content reveal the functional programs used in each sequence. For each sequence, programs colored based on the key in d and are plotted as a fraction of total program content. Note, in a few cases, sequences were not assigned to any program with any frequency yielding a blank bar. Line plots display MPRA log2FC scores for the above sequences in K562 (teal), HepG2 (yellow), and SK-N-SH (red). Sub-panels are organized into rows by expected target cell type and columns by method used to nominate candidate sequences. Sequences in each panel are sorted by hierarchical clustering based on program content.

