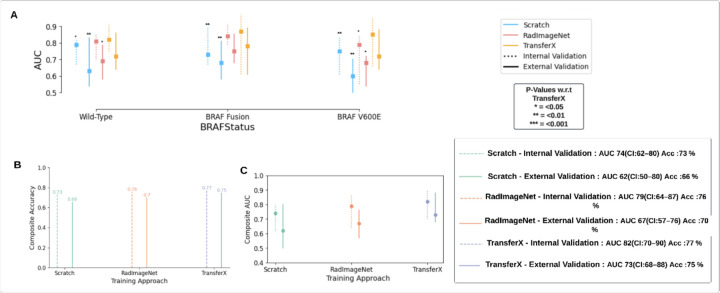
Figure 3.
(A) AUC is plotted and compared for the pipeline results with individual subtype classifiers trained using different training approaches (Scratch, RadImageNet FineTune, TransferX) for respective mutation class (BRAF-V600E, BRAF-Fusion, Wild-type). P-values are generated from model comparisons with respect to TransferX. (B) Accuracy and (C) AUC comparison of the pipeline with individual subtype classifiers trained with three different training approaches. The composite Accuracy and AUC for the entire dataset is calculated by the weighted average of the AUCs and Accuracy across the three mutational classes. AUC: area under the curve.

