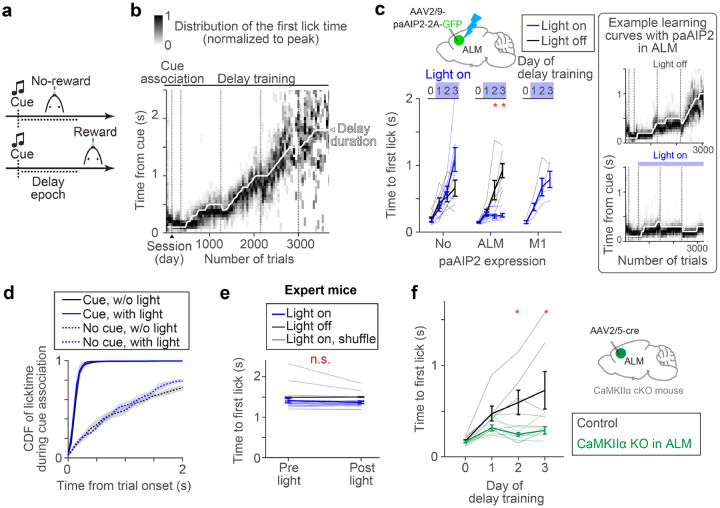
Figure 1. CaMKII activity in ALM is required for delay learning.
a. Task design.
b. Example learning curve. Distributions of lick time per trial bin are shown (50 trials; Methods). Vertical dotted lines separate sessions.
c. paAIP2 manipulation during learning. The blue light was on during the delay training but not cue association. Day 0, the last day of cue association. The median lick times of the last 100 trials are shown. Thick lines, mean ± SEM. Thin lines, individual mice (n > 5 for ‘ALM’ and ‘No’ per condition, and n = 4 for ‘M1’). *: p < 0.05 (bootstrap followed by Bonferroni correction). See Extended Data Table 3 for the exact n and p-values. Right, example learning curves of mice with paAIP2 expression in ALM (top, light off; bottom, light on). The format is the same as in b.
d. Distribution of first lick time on the second day of cue association. ‘Cue’ and ‘No cue’, trials with and without a cue, respectively (Methods; cue starts at the trial onset in cue trials). Different distributions between cue and no cue trials indicate successful cue association. Shade, SEM. pcue with vs. w/o light = 0.571 (ranksum test, n = 3 and 5 mice, light on and off respectively).
e. ALM paAIP2 manipulation in expert animals. Comparing the first lick time within a session (100 trials before and after the onset of blue light). Thick lines, mean ± SEM. Thin lines, individual sessions (n = 4 mice, 20 sessions). p = 0.117 (bootstrap). See Methods for the shuffle procedure.
f. Knocking out CaMKIIα expression in ALM. Thick lines, mean ± SEM. Thin lines, individual mice (n = 6 mice per condition). *: p < 0.05 (bootstrap followed by Bonferroni correction).

