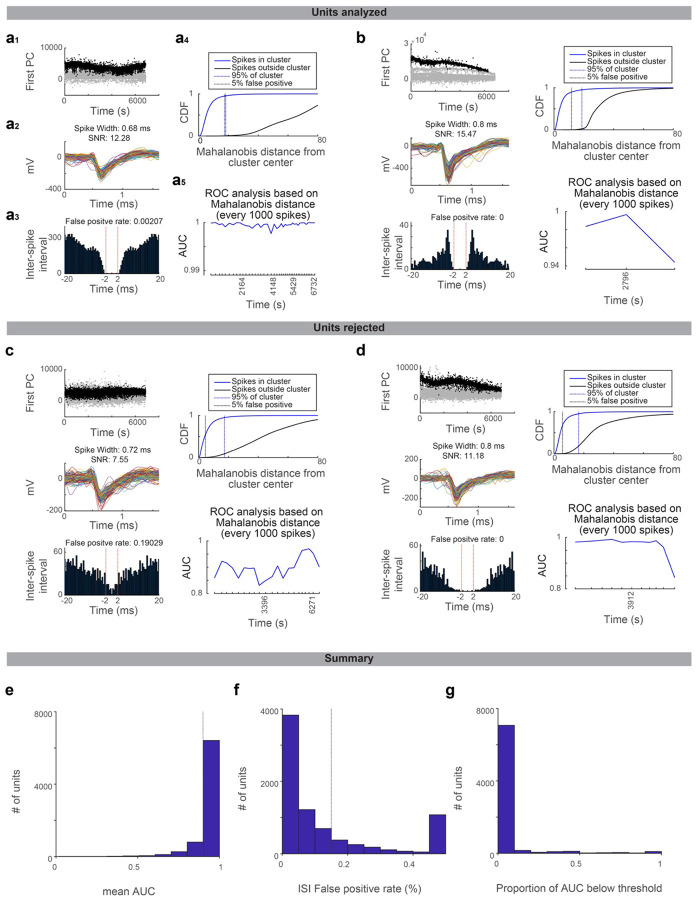
Extended Data Figure 6. Quality metrics of spike-sorted units.
Drifts in the recording affect spike sorting quality. We implemented rigorous quality metrics evaluating cluster isolation across time points within a recording session to minimize the effect of recording drift in our analysis.
a. An example unit that passed the quality standard. a1, projection of spike feature along the first PC. Time, the time within the recording session. Black dots, spikes belonging to the unit. Gray dots, all the other spikes sharing the peak channel (i.e., recorded at the same or adjacent recording sites). a2, spike shape of the unit belonging to this unit. Randomly selected 250 spikes are overlaid. a3, the inter-spike interval of spikes belonging to the unit (see Methods for false positive rate). a4, Mahalanobis distance (calculated based on spike features) of each spike from the center of the unit cluster. CDF is shown for spikes belonging to the unit (blue) and all other spikes sharing the peak channel (black). Blue dotted line, 95% point of spikes belonging to the unit. Black dotted line, the distance where the false positive rate reaches 5%. a5, ROC analysis of the Mahalanobis distance (distinguishing spikes belonging or not belonging to the unit; Methods). AUC is calculated for each time window containing every consecutive 1000 spikes belonging to the cluster.
b. The same as in a for different unit.
c-d. The same as in a for different units not passing the quality standard due to high false alarm rate in inter-spike interval analysis (c) or mean AUC lower than the threshold (d).
e. The histogram of mean AUC (AUC averaged across all time windows) across all manually curated units. Quality criterion: mean AUC > 0.9 (dashed line).
f. The histogram of the false-positive rate calculated according to the inter-spike interval across all manually curated units.
g. No single time window should have AUC < 0.75 to pass the quality criteria. The proportion of AUC below the threshold (across all manually curated units) is shown for all manually curated units.

