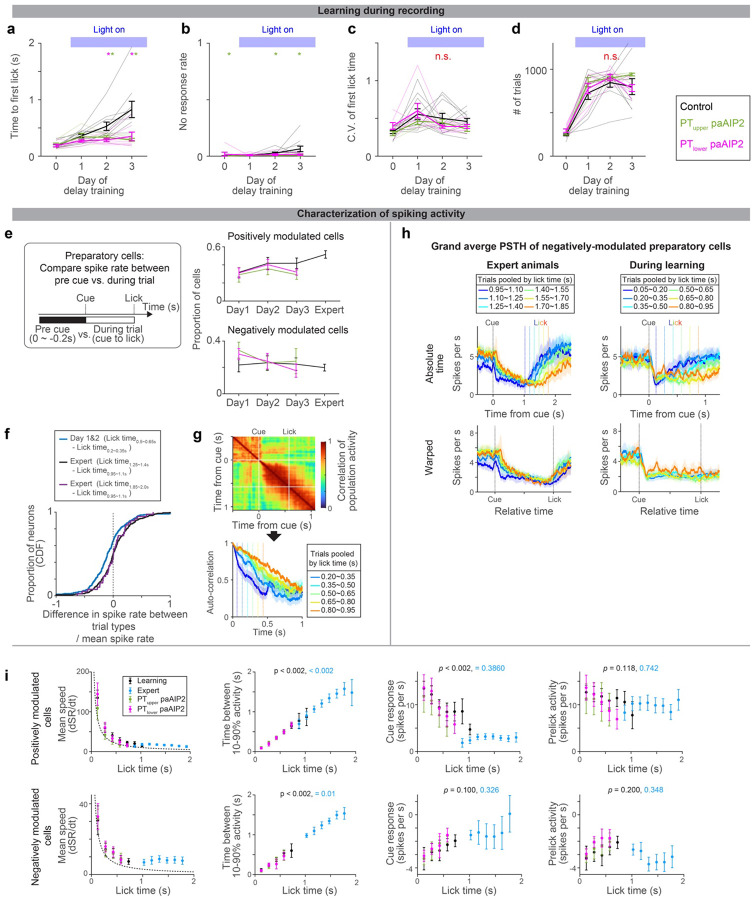
Extended Data Figure 7. ALM dynamics during learning.
a-d. Behavioral performance of the animals during ALM recording (different cohorts of mice from those analyzed in Fig2c; the same cohorts of mice analyzed in Fig.4). Time to first lick (a), no-response rate (b), coefficient of variation (c), and number of trials per session (d) are shown. Thick lines, mean ± SEM. Thin lines, animals. N = 10, 5, 7 mice for control, PTupper, and PTlower manipulation, respectively. *: p< 0.05 control vs. PTupper manipulation or control vs. PTlower manipulation conditions (indicated by the color of *; bootstrap followed by Bonferroni correction; Extended Data Table 3), n.s., p >0.05 for all comparisons. The result is consistent with behavior without recording (Fig. 2 and Extended Data Fig. 1).
e. The proportion of cells with positive or negative-modulated preparatory activity (spike rate between cue to the first lick significantly higher or lower from that in the baseline, repsectively; two-sided signed-rank test, p < 0.05). Error bar, SEM (hierarchical bootstrap). p > 0.05 for all comparisons of proportion (on days 1, 2, and 3) between control vs. manipulations (hierarchical bootstrap). Thus, the paAIP2 manipulation does not affect the proportion of preparatory neurons.
f. Spike rate significantly decreased during learning. ( was calculated for each neuron and the distributions of this value are shown as CDF, where denotes the mean spike rate between cue to first lick. During the training, a significant proportion of neurons decreased spiking activity as mice licked later (blue; p = 1.18 × 10⁻⁶, signed-rank test, n = 269 cells; median −0.103; based on neurons shown in Fig. 3g). In contrast, in the expert, there was no significant change in spike rate (black; p = 0.27, signed-rank test, n = 344 cells; median: −0.001; based on neurons shown in Fig. 3c) even when the fold-difference in lick time between trial types is roughly matched to that in Day1&2 (purple; p = 0.69, signed-rank test, n = 39 cells; median: 0.006). Altogether decrease in spike rate is unique to during learning.
g. Autocorrelation of ALM population activity (top; trials with lick time between 0.50 and 0.65 s) to estimate time-constant of population activity (bottom; different trials are shown in different colors). The correlation of population activity between time points: (Tcue + Tlick)/2 vs. following time points, is shown, where Tcue and Tlick denote the time of cue and lick, respectively. Vertical dotes lines, lick times. Consistent with Fig. 3, the time constant of population dynamics increased as mice learned to lick later.
h. Grand average peri-stimulus time histogram (PSTH) of negatively-modulated ALM preparatory neurons. The same format as in Fig. 3b. Shade, SEM. Trial types with more than 25 neurons are shown.
i. Characterization of PSTH of positively and negatively modulated ALM preparatory neurons. The format is the same as in Fig. 3i–k, and the data of paAIP2 manipulation is overlaid. Mean speed, the average spike rate (SR; spikes per sec) change between cue to lick. Dotted line, expected mean speed (mean pre-lick activity divided by lick time). The mean speed (first column) decreases, and time between 10–90% activity (second column) increases as animals lick later, consistent with a view that dynamics are temporally stretched. The absolute values of the cue response (third column) decrease during learning, whereas pre-lick activity (fourth column) is stable in both positively and negatively modulated cells. Trial types with more than 50 trials were analyzed.

