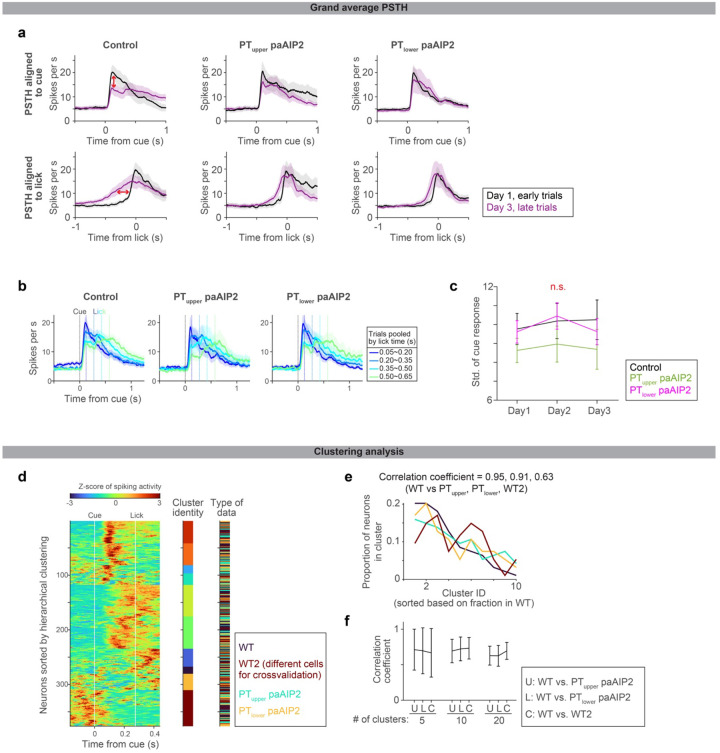
Extended Data Figure 9. Similar ALM activity across experimental conditions when mice licked around the same time.
a. Comparisons of the grand average PSTHs of positively-modulated ALM preparatory neurons on day 1 early trials vs. day 3 late trials (regardless of lick time; the same dataset is quantified in Fig. 4c–d). PSTHs are aligned to cue (top) or lick (bottom). Control shows a clear change in cue response and ramping activity (red arrows). Early and late trials, first 75 and last 75 trials in the session. See Extended Table 3 for number of neurons analyzed.
b. When mice lick around the same time (regardless of the day of training), the grand average PSTHs of ALM are similar regardless of paAIP2 manipulation. The grand average PSTHs of positively-modulated ALM preparatory neurons for individual manipulation types are shown. Activity in trial types with different lick timings is shown in different colors. The paAIP2 manipulation sessions had fewer trials with later licks. The same format as in Fig.3f. Shade, SEM. The control data is duplicated from Fig. 3f for comparison purposes.
c. The standard deviation of cue response (related to Fig. 4d; calculated based on early trials; late trials yield similar results). The standard deviation and CV (not shown) of cue response are not significantly different between control and paAIP2 manipulation. p = 0.284, 0.322, 0.274 (day 1, 2, 3 comparing control vs. PTupper paAIP2 manipulation) and 0.830, 0.800, 0.592 (day 1, 2, 3 comparing control vs. PTlower paAIP2 manipulation; hierarchical bootstrap). Although the across-trial fluctuation in cue response is the same, the mean cue response changed between early and lick trials only in control (Fig. 4d). Thus, the paAIP2 manipulation blocks the directional change in cue response without affecting the across-trial fluctuation.
d. Clustering analysis to test whether we can distinguish ALM activity patterns between control and paAIP2 manipulation conditions. Z-scored spiking activity of ALM neurons recorded in control animals (WT) and animals with PT-specific paAIP2 manipulations is shown. Neurons from each experimental condition were subsampled and pooled (94 neurons per condition were randomly sampled without replacement; two different groups of neurons were randomly subsampled in the WT condition for cross-validation and denoted WT and WT2). Then we performed hierarchical clustering of the mean activity pattern of these neurons (here, the number of clusters was set to 10). Mean spiking activity in trials with a first lick time between 0.2 and 0.35 s was analyzed. The cluster identity of each neuron is shown in different colors in the middle column, and the type of experimental condition is shown in the right column (see legend in the figure for color scheme). Each cluster contains neurons recorded in all experimental conditions, implying that ALM neurons with similar activity patterns were recorded across experimental conditions.
e. Fraction of neurons in each cluster in panel d. The cluster ID is sorted based on the proportion of neurons in WT data. The correlation coefficients of the proportion of neurons between experimental conditions, indicating similarity in the composition of activity patterns, are shown at the top.
f. We have repeated this correlation analysis shown in d-e 1000 times (sampling random subsets of neurons without replacement; we have tested different numbers of clusters: 5, 10, or 20, all of which yielded similar results) to plot the mean and SEM. C, control: the correlation between WT vs. WT2, showing the upper bound of the correlation coefficient with this procedure and sample size (as neurons are sampled from the same dataset). Both PTupper and PTlower paAIP2 manipulation conditions have similar correlation coefficients to control (p > 0.05), indicating that activity patterns in ALM are indistinguishable across conditions when mice lick around the same time, i.e., paAIP2 manipulations in PT neurons do not change task-related activity patterns in ALM.

