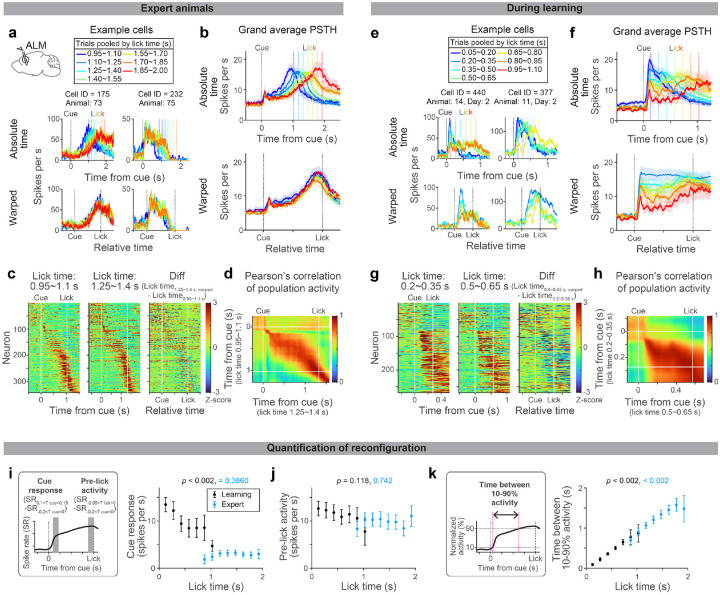
Figure 3. Evolution of ALM dynamics during delay learning.
a. Spiking activity of example neurons in expert mice. Lines with different colors indicate the mean spike rate of trials with different first lick times (vertical dotted lines in the same color indicate the corresponding lick time). Top, activity in absolute time. Bottom, activity in relative time, following temporal warping (all trials were warped to have identical lick time; Methods).
b. Grand average peri-stimulus time histogram (PSTH) of positively-modulated ALM preparatory neurons (cells with the mean spike rate between cue and lick significantly higher than the baseline). The same format as in a. Shade, SEM. Trial types with more than 50 neurons are shown. See Extended Data Table 3 for the number of neurons analyzed.
c. Z-scored spiking activity of preparatory ALM neurons in trials with first lick time within 0.95–1.1 s (first column) and 1.25–1.4 s (second column). All preparatory neurons with these two trial types are shown (n = 344 cells). The difference between the first and second columns after temporal warping (third column).
d. Pearson’s correlation of population activity between two trial types shown in c.
e-h.Same as in a-d for during learning. g-h: N = 269 cells. Note that many cells show a decrease in spiking activity as mice lick later (third column), unlike in the expert mice (c), consistent with the population average (f).
i. Comparison of cue response between trials with different lick times (calculated based on the grand average PSTH shown in b and f). P-value; hierarchical bootstrap testing the significance of correlation coefficient between lick time vs. cue-response (with a null hypothesis that there is no correlation). Error bar, SEM (hierarchical bootstrap). Left, schema showing time windows used to calculate cue response and pre-lick activity. SR, spike rate. Tcue, time from the cue. Tlick, time from lick.
j. Same as in i for pre-lick activity.
k. The time between 10% to 90% activity is calculated for the grand average PSTH shown in b and f (Methods). P-value; hierarchical bootstrap testing the significance of correlation coefficient between lick time vs. the time between 10–90% activity. Error bar, SEM (hierarchical bootstrap).

