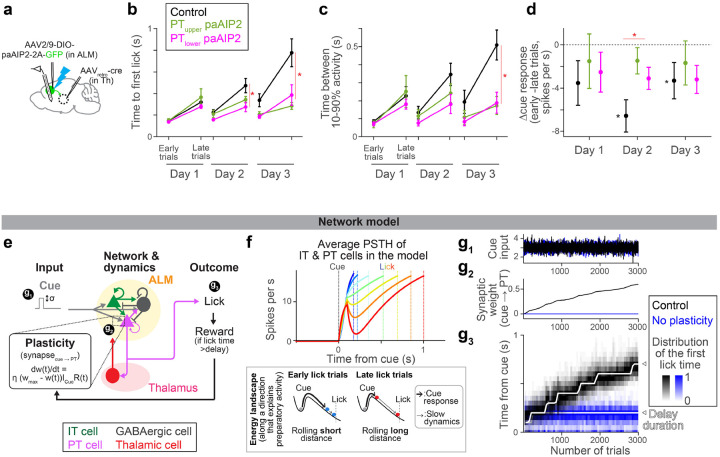
Figure 4. CaMKII manipulation in ALM PT neurons impedes the evolution of preparatory activity.
a. Schema. Recording of extracellular activity in ALM during paAIP2 manipulation of PTupper (or PTlower) neurons.
b. Time to first lick during delay training with recording (different cohorts of mice from those tested without recording in Fig.2c). Lines, mean ± SEM. *: p = 0.476, 0.005, <0.001 for day 1, 2, and 3 of delay training, respectively, comparing control vs. PT-specific paAIP2 manipulation (both PT cell types were pooled for statistics because we did not observe a qualitative difference between these two groups; the same in c and d; hierarchical bootstrap with a null hypothesis that the increase in lick time within a session is not larger in control). See Extended Data Table 3 for comparisons of each PT cell type and sample size. Early and late trials, first 75 and last 75 trials in the session.
c. The time between 10% to 90% activity of positively-modulated ALM neurons is compared across manipulation types. Lines, mean ± SEM. *: p = 0.400, 0.095, 0.009 for day 1, 2, and 3, respectively, comparing control vs. PT-specific paAIP2 manipulation (both PT cell types were pooled; hierarchical bootstrap with a null hypothesis that the increase within a session is not larger in control). See Extended Data Table 3 for comparisons of each PT cell type and sample size.
d. The change in cue amplitude of positively-modulated ALM neurons within sessions (late trials – early trials; Δcue response) of. Lines, mean ± SEM. * in red: p = 0.273, 0.006, 0.362 for day 1, 2, and 3, respectively, comparing control vs. PT-specific paAIP2 manipulation (both PT cell types were pooled; hierarchical bootstrap with a null hypothesis that the decrease within a session is not larger in control). * in black: p = 0.039, <0.001, 0.002 on day 1, 2, and 3, respectively, for hierarchical bootstrap with a null hypothesis that Δcue response is non-negative in control mice.
e. Schema of the model (see Methods for details). All synaptic connections are excitatory, except for the ones from GABAergic neurons. “t” in the learning rule, trial.
f. Top, dynamics of ALM neurons across lick times in the model (the mean of IT and PT neurons activity). Different color indicates activity in trials with different lick times. Dotted lines, corresponding lick times. Bottom, schemas of the energy landscape in early and late lick trials (along a long-time constant dimension that captures preparatory activity). Note that the full dynamics (top) is not monotonic due to activity along other directions.
g. The amplitude of cue input (g1), synaptic weight of cue to PT synapse (g2), and lick timing (g3) during learning in the model.

