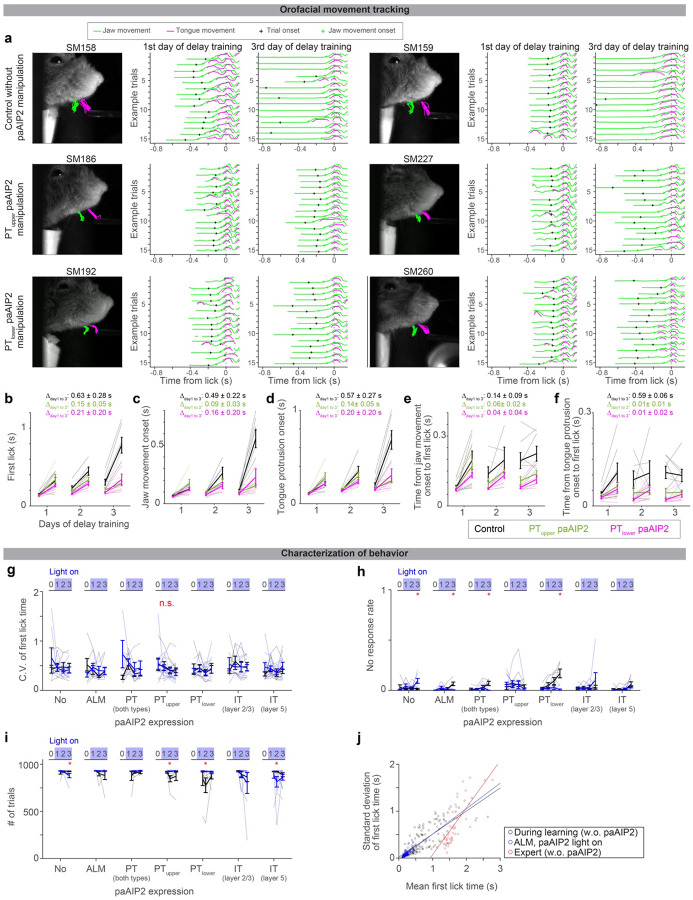
Extended Data Figure 1. Characterization of behavior during delay training.
a. Tracking of jaw and tongue, using high-speed videography and DeepLabCut87. Six example animals (2 per experimental condition) are shown. Left, video clip overlayed with example trajectories of jaw (green) and tongue (magenta) (15 trials). Middle, trajectories of jaw and tongue at the beginning of delay training (from trial 50 to 65 on day 1 of delay training). Trajectories are aligned to lick onset, where lick onset is defined as the moment tongue touches the lick port for the first time after the cue. Black cross, cue (trial) onset. Green cross, the onset of jaw movement (Methods; analyzed in panels c and e). Right, the same as in the middle but for later in delay training (trial 50 to 65 from the end of day 3 of delay training).
b-f. Summary of the first lick time (b), jaw movement onset (c), tongue protrusion onset (d), time from jaw movement onset to the first lick (e), and time from tongue protrusion onset to the first lick (f) (Methods). Comparing the first and last 100 trials within a session. Thick lines, mean ± SEM. Thin lines, individual mice (n = 7, 5, and 7 for control, PTupper paAIP2 manipulation, and PTlower paAIP2 manipulation, respectively). The delayed tongue and jaw movement (i.e., withholding of orofacial movement after the cue onset) mainly explains the delayed lick time.
g-i. Characterization of behavior during paAIP2 manipulation. The coefficient of variation (C.V.) of first lick time (g). No-response rate (h). Numbers of trials per session (i). These are based on animals and sessions analyzed in Fig. 2c. Thick lines, mean ± SEM. Thin lines, individual animals. No change in C.V. between control vs. paAIP2 manipulation indicates that the manipulation did not affect the variability of lick timing. No significant increase in the no-response rate and no significant decrease in the number of trials in paAIP2 manipulation implies that the manipulation did not block cue-triggered lick and motivation (note that all significant changes are in the opposite direction). *: p < 0.05 (bootstrap followed by Bonferroni correction; Extended Data Table 3); n.s.: p > 0.05 for all comparisons.
j. Relationship between mean vs. standard deviation of first lick time. The standard deviation of lick time scales with its mean, adheres to Weber’s law50,52. This is why we analyzed CV (standard deviation divided by mean) to evaluate across-trial variability in lick time (e.g., g). Circle, the first 100 or last 100 trials of each session. Lines, least-square fitted lines. The slope of the fitted line: 0.49 (0.43 – 0.56), 0.53 (0.45–0.64), and 1.00 (0.77–1.35), mean (5 – 95 % confidence interval, bootstrap) for during learning (control), during learning (paAIP2 in ALM with light on), and expert, respectively. Thus, ALM paAIP2 manipulation does not affect the variability of lick time.

