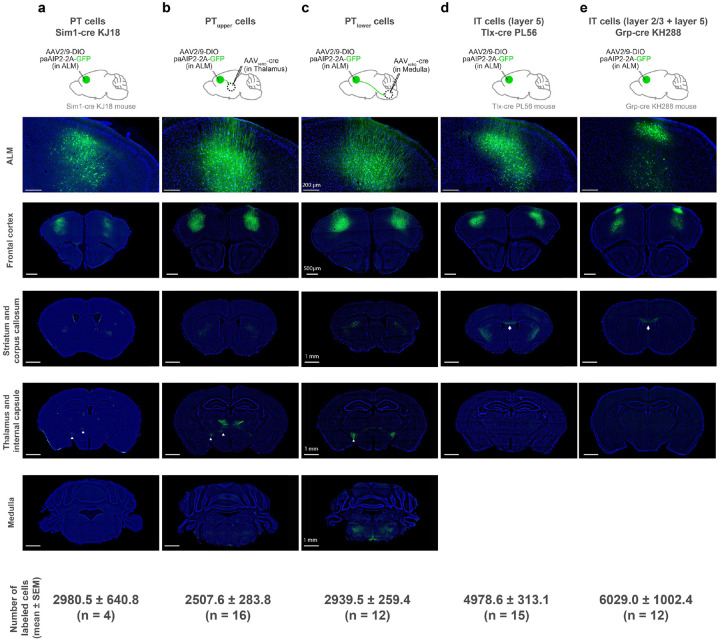
Extended Data Figure 4. Histological validation of cell-type-specific manipulation.
a. paAIP2-GFP expression in ALM PT neurons and some layer 2/3 neurons in Sim1-cre KJ18 mice.
b. paAIP2-GFP expression in ALM PTupper neurons (due to the tropism of AAVretro47, layer 6 neurons are only sparsely labeled).
c. paAIP2-GFP expression in ALM PTlower neurons.
d. paAIP2-GFP expression in ALM layer 5 IT neurons in Tlx-cre PL56 mice.
e. paAIP2-GFP expression in layer 2/3 IT and some layer 5 IT neurons in Grp-cre KH288 mice.
Top, paAIP2-GFP expression in ALM. Bottom panels, paAIP2-GFP expression in 4 coronal sections from anterior to posterior showing expression in the frontal cortex, striatum and corpus callosum, thalamus, and medulla. See Extended Data Table 1 for injection coordinates. Signal in the corpus callosum (white arrows) in d and e confirms the labeling of IT neurons. Whereas the lack of signal in the corpus callosum in b and c confirms a lack of co-labeling of IT neurons. Signal in the thalamus and internal capsule (white arrowheads) in a, b, and c confirms the labeling of PT neurons. In contrast, the lack of signal in the thalamus and internal capsule in d and e confirms a lack of co-labeling of PT neurons. The labeling of PT neurons in Sim1-cre KJ18 mice (a) was sparser than the labeling of PTupper or PTlower neurons by AAVretro (i.e., b and c). In addition, we note that Sim1-cre KJ18 labels some layer 2/3 neurons in ALM. Scale bars are identical across panels in each row.

