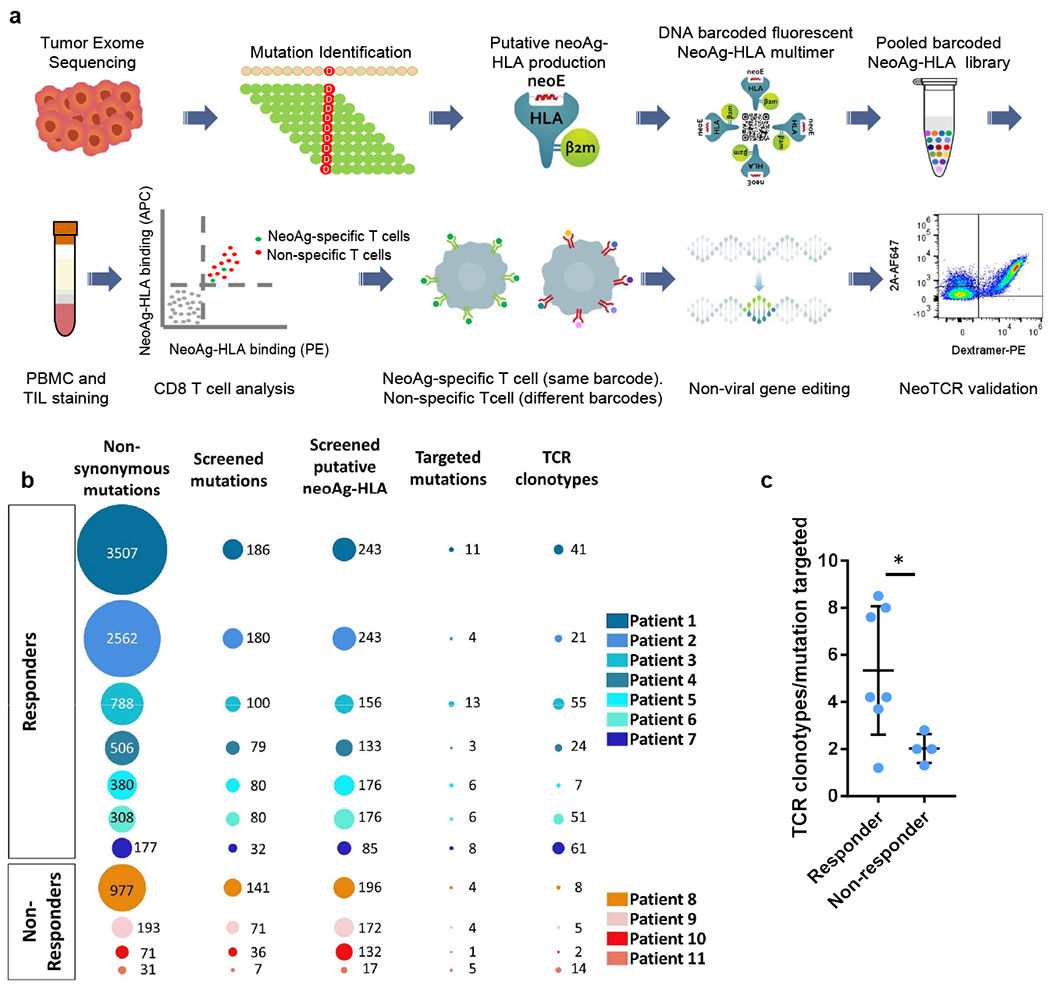
Fig. 1 |. Neoantigen-specific T cell screening and TCR clonotype identification.

a, Schematic of neoantigen-specific TCR isolation from patient samples. NeoAg, neoantigen. b, Representations of the number of non-synonymous mutations, mutations screened, predicted neoantigen–HLA complexes screened, mutations targeted by neoantigen-specific T cells and neoantigen-specific T cell clonotypes isolated in patients with (patients 1–7) or without (patients 8–11) a response to anti-PD-1 therapy. c, Ratio of the number of neoantigen-specific TCR clonotypes isolated per mutation targeted in each patient. Data are mean ± s.d. with individual values. n values indicate the number of different patients; n = 7 (responders) and n = 4 (non-responders). *P = 0.0434, calculated using a two-tailed unpaired t-test, using the two-stage linear step-up procedure of Benjamini, Krieger and Yekutieli, with Q = 1%.
