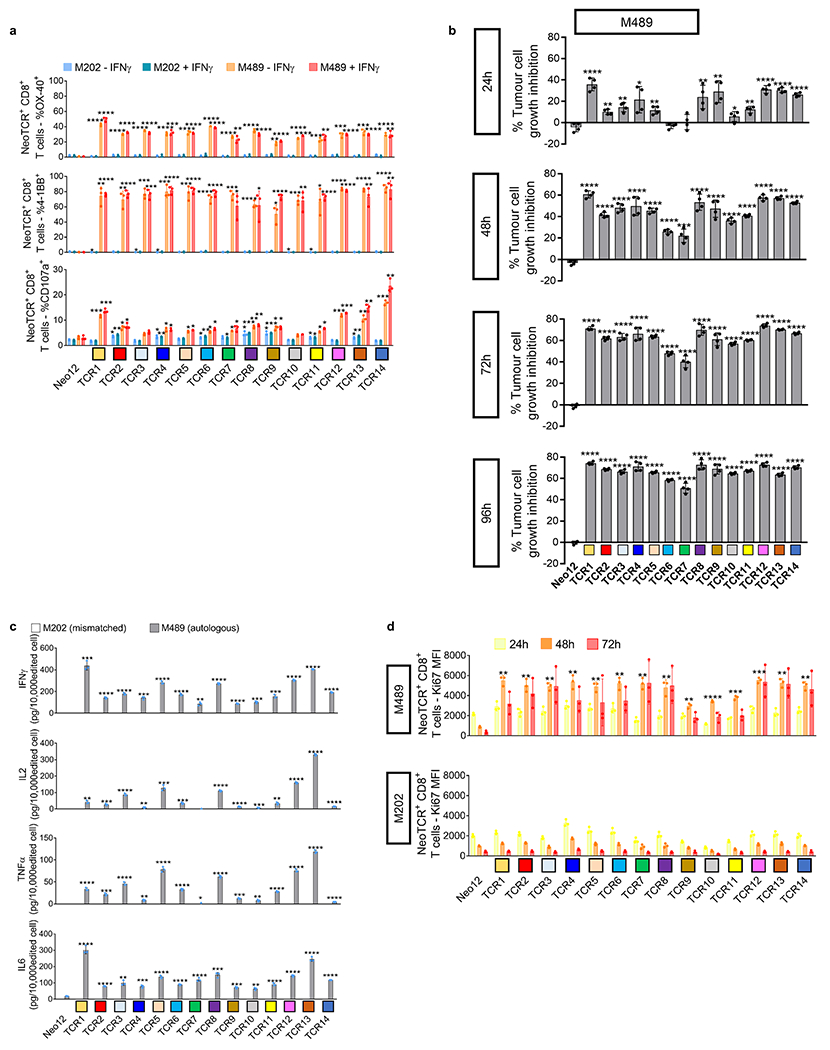
Extended Data Fig. 6 |. Activation, cytotoxicity, cytokine secretion, and proliferation induced by neoantigen-specific TCRs from patient 2 upon co-culture with the autologous cell line.

Healthy donor T cells genetically engineered to express the captured neoTCRs from patient 2 were co-cultured with the autologous (M489) or a mismatched cell line (M202). a, 4-1BB, OX-40, and CD107a upregulation in the CD8+ neoTCR+ T cells after co-culture. Melanoma cell lines were pre-treated with regular media or media with IFNγ 24 h prior co-culture with T cells (n = 3). b, percentage of tumour growth inhibition in M489 autologous cell line compared to the cell growth in media alone at 24, 48, 72 and 96 h (n = 4). c, Cytokine release at 24 h after co-culture (n = 3). d, Proliferation of CD8+ neoTCR+ T cells measured by Ki67 mean fluorescence intensity upon 24, 48 and 72 h co-culture with autologous melanoma cell line (M489, top panel) or a mismatched cell line (M202, bottom panel) (n = 3). * p < 0.05, ** p < 0.005, ***p < 0.0005, ****p < 0.0001 vs Neo12, two-tailed unpaired t test with Holm-Sidak adjustment for multiple comparisons in figure a, b and c. * p < 0.05, ** p < 0.005, ***p < 0.0005, ****p < 0.0001 vs M202, two-tailed unpaired t test with Holm-Sidak adjustment for multiple comparisons in figure d. Exact p-values provided in Supplementary Information. (n) indicates the number of biological replicates. Mean ± SD and individual values are shown. All T-cell products contain CD8+ and CD4+ gene-edited T cells.
