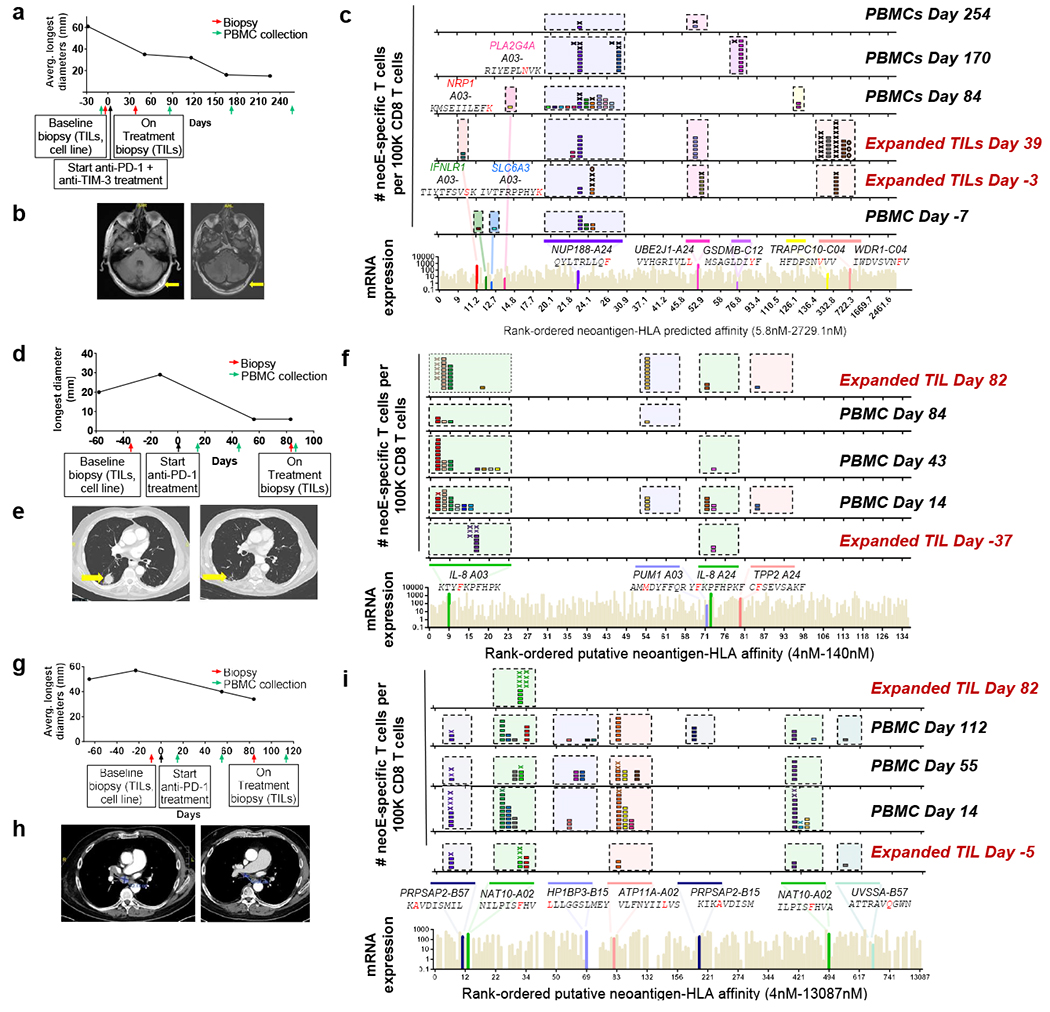
Fig.2 |. Neoantigen-specific T cell isolation from TILs and PBMCs in patients with a response to anti-PD-1 therapy.

a, Tumour measurements over time and sample collection for patient 1. b, Magnetic resonance imaging (MRI) scans from patient 1 at the baseline (day −12, left) and on treatment (day 428, right). c, Landscape analysis of the neoantigen-specific T cells over time in patient 1. Bottom, mRNA expression, measured in absolute reads and predicted HLA-binding affinity of the putative neoantigens screened. Neoantigens targeted by T cells are highlighted in different colours, and the mutated gene name, the sequence of the neoantigen with the point mutation marked in red and the HLA are indicated at the top. The same colour code is used in the top panels to show the neoantigen specificity of the isolated T cells. The six top panels show the evolution over time of the neoantigen-specific T cells in TILs and PBMCs. Each box represents one isolated T cell, each cross is equivalent to ten isolated T cells and each circle is equivalent to 100 isolated T cells. Each colour represents a different neoantigen-specific T cell clonotype. The number of isolated T cells was normalized to 100,000 CD8+ T cells using a round-up method to plot the results. Only T cell clonotypes that demonstrated binding to neoantigen–HLA complexes once expressed in healthy donor T cells are shown, d, The same as in a, but for patient 2. e, Computed tomography (CT) scans from patient 2 at baseline (day −13, left) and on treatment (day 56, right). L, left; R, right. f, The same as in c, but for patient 2. g, The same as in a, but for patient 6. This patient had two target lesions; the average of the longest diameters is shown. h, CT scans from patient 6 at baseline (day −23, left) and on treatment (day 84, right). i, The same as in c, but for patient 6.
