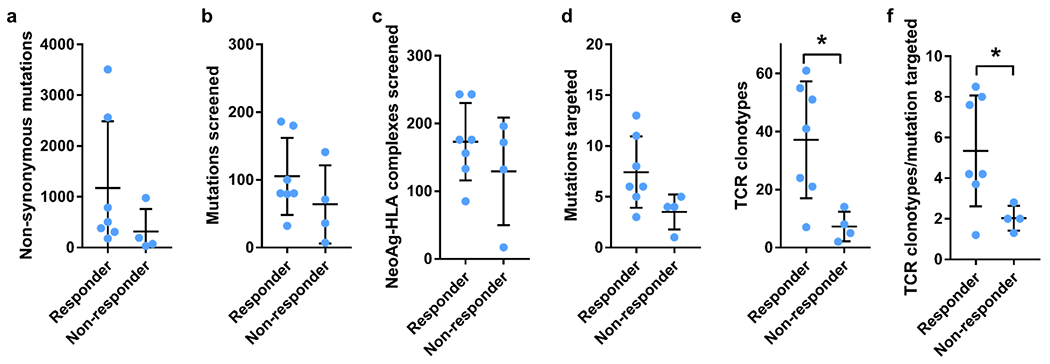
Extended Data Fig. 1 |. Neoantigen-specific T-cell isolation and TCR clonotype identification. Summary of key parameters from the longitudinal landscape analysis of neoantigen-specific T cells in patients with and without response to therapy.

a, Total number of non-synonymous mutations. b, Total number of mutations screened. c, Total number of predicted neoantigen–HLA complexes screened. c, Total number of mutations targeted. e, Total number of neoantigen-specific TCR clonotypes isolated. f, Ratio of the number of neoantigen specific TCR clonotypes isolated per mutation targeted in each patient. Mean ± SD and individual values are plotted. (n) indicates the number of different patients, n = 7 for responders and n = 4 for non-responders. * p < 0.05, two-tailed unpaired t test, using the Two-stage linear step-up procedure of Benjamini, Krieger and Yekutieli, with Q = 1%. p = 0.0190 for TCR clonotypes and p = 0.0434 for TCR clonotype/mutation targeted.
