
Extended Data Fig. 2 |. Neoantigen-specific T-cell isolation from PBMCs in patients with response to anti-PD-1 therapy.
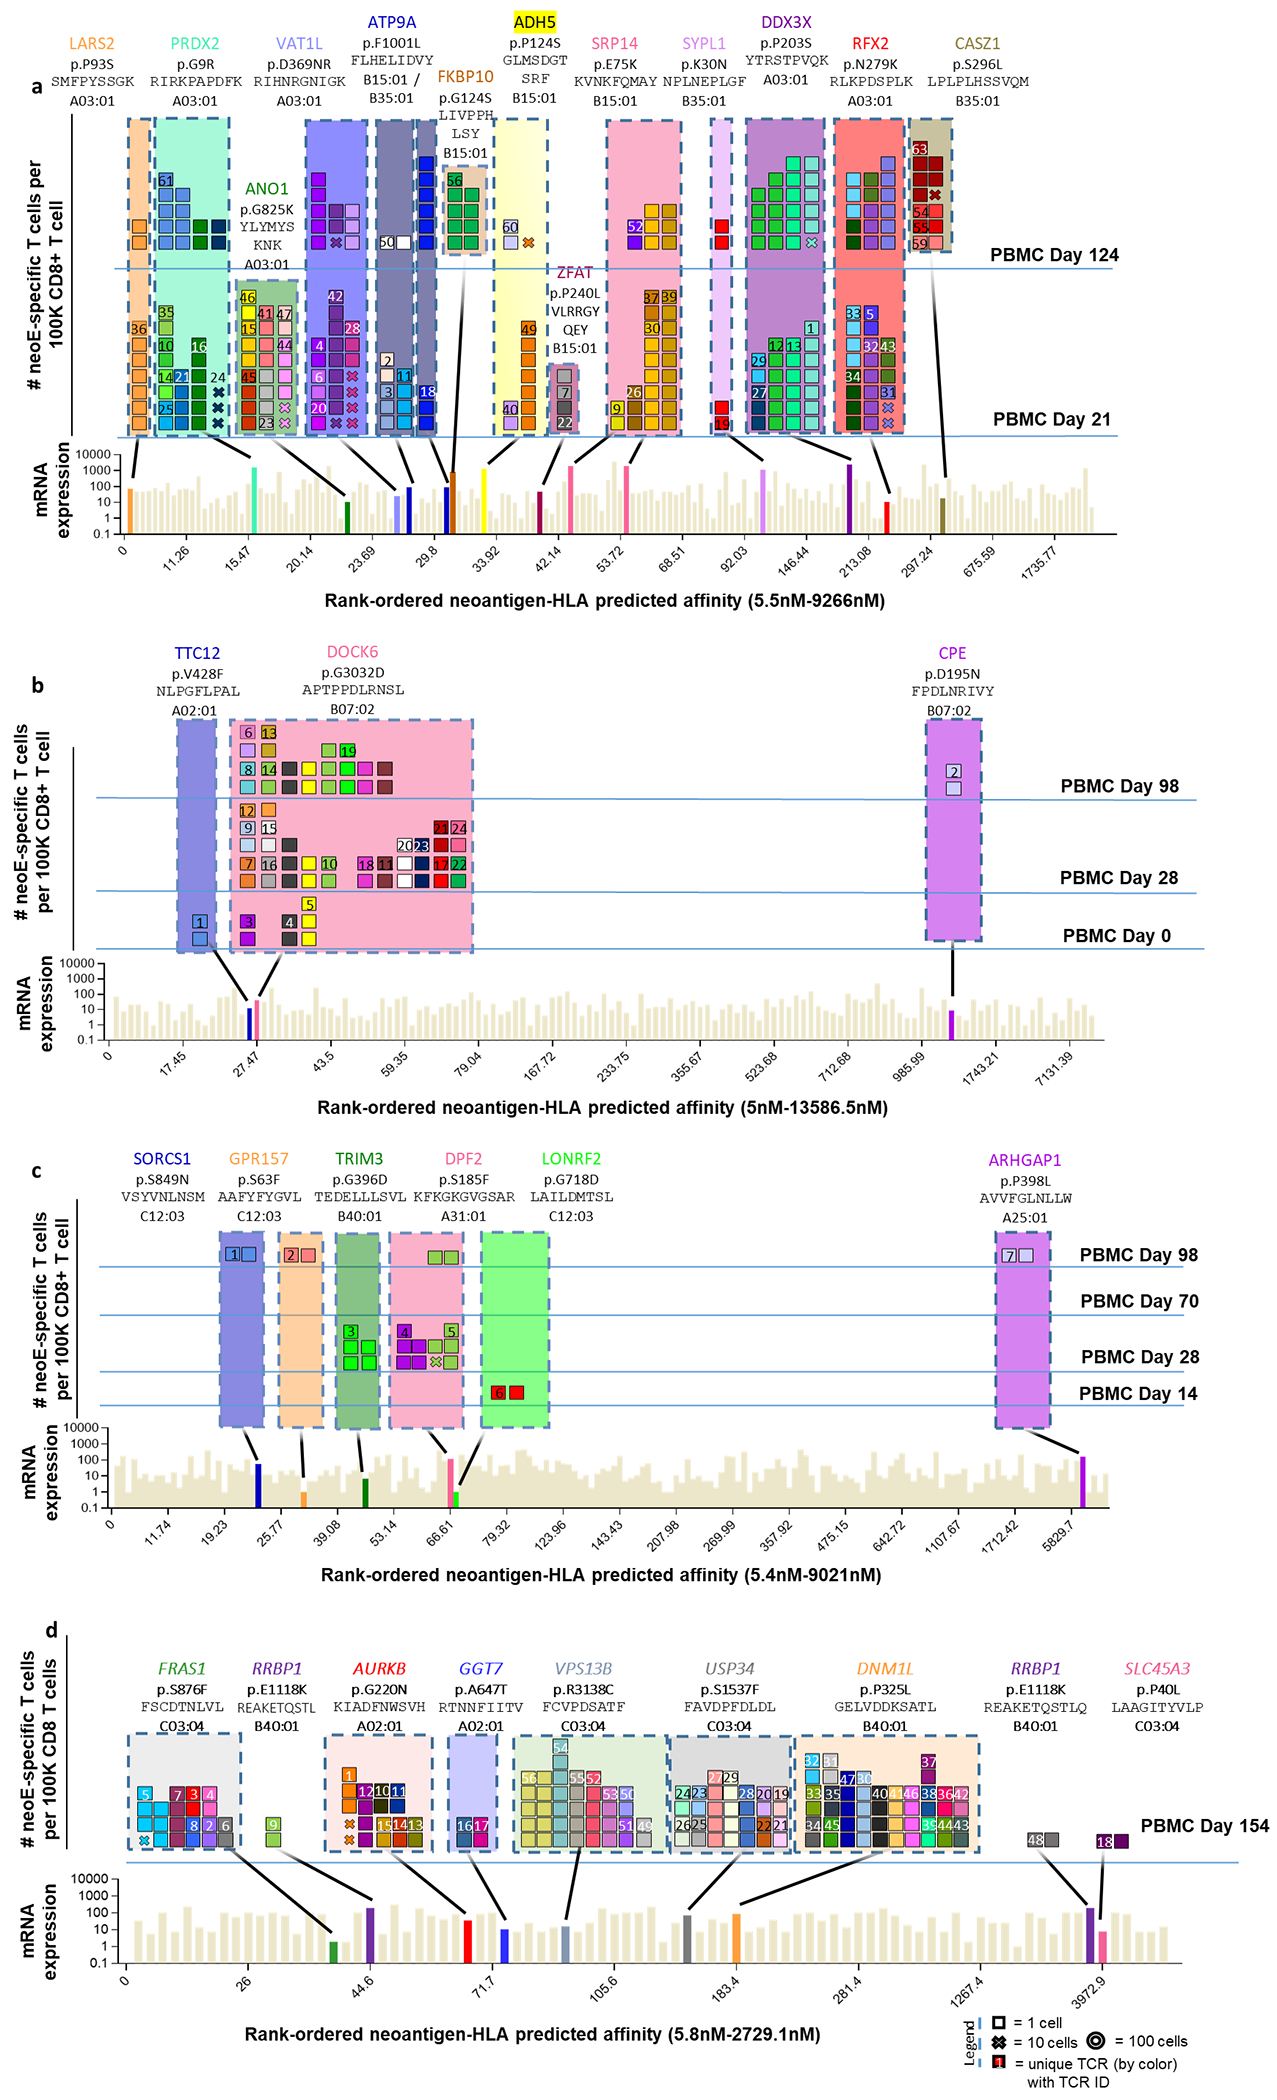
a, Landscape analysis of the neoantigen-specific T cells over time in patient 3. Bottom panel shows mRNA expression and predicted HLA binding affinity of the putative neoantigens screened. Neoantigens targeted by T cells are highlighted in different colours. The same colour code is used in the top panels to show the neoantigen specificity of the isolated T cells. The top panels show the evolution over time of the neoantigen-specific T cells in PBMCs. Each box represents one isolated T cell, each cross is equivalent to ten isolated T cells, and each circle is equivalent to 100 isolated T cells. Each colour represents a different neoantigen-specific T-cell clonotype. The TCR ID is also plotted. The number of isolated T cells is normalized to 100,000 CD8+ T cells using a round up method to plot the data. The mutated gene name, the point mutation, the sequence of the neoantigen, and the HLA are indicated on top of the figure. The T cell clonotypes shown have not been validated by expression in healthy donor T cells and binding to neoantigen–HLA complexes. b, Same as a for patient 4. c, Same as a for patient 5. d, Same as a for patient 7.