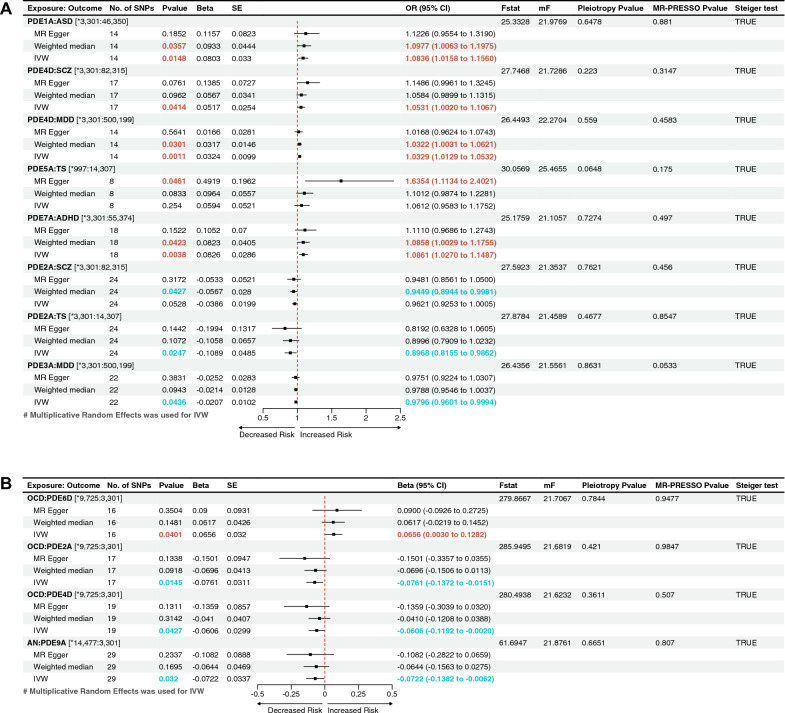
Fig. 2.
The forest plot shows the significant causalities. Associations between genetically predicted phosphodiesterases (PDEs) and the risk of psychiatric disorders (A). Associations between genetically predicted psychiatric disorders and PDEs (B). The causal relationships between PDEs and the risk of psychiatric disorders were presented using OR and 95% CIs. Additionally, beta and 95% CIs were used to present the causal relationships between psychiatric disorders and PDEs. Both the pleiotropy p value and the MR-PRESSO p value are greater than 0.05, which means that there is no directional pleiotropy and horizontal pleiotropy. No number, SNP single nucleotide polymorphism, beta, genetic effect size from the exposure GWAS data, SE standard error of effect size, OR odds ratio, CI confidence interval; F-statistic, [F = ((R2/(1 − R2)) × ((N − K − 1)/K)]; mF, F = beta2/SE2; Pleiotropy p value, Egger intercept p value; MR, Mendelian randomization; MR-PRESSO p value, MR pleiotropy residual sum and outlier “Global Test” p value. *The sample size of the respective genome-wide association study (GWAS) datasets

