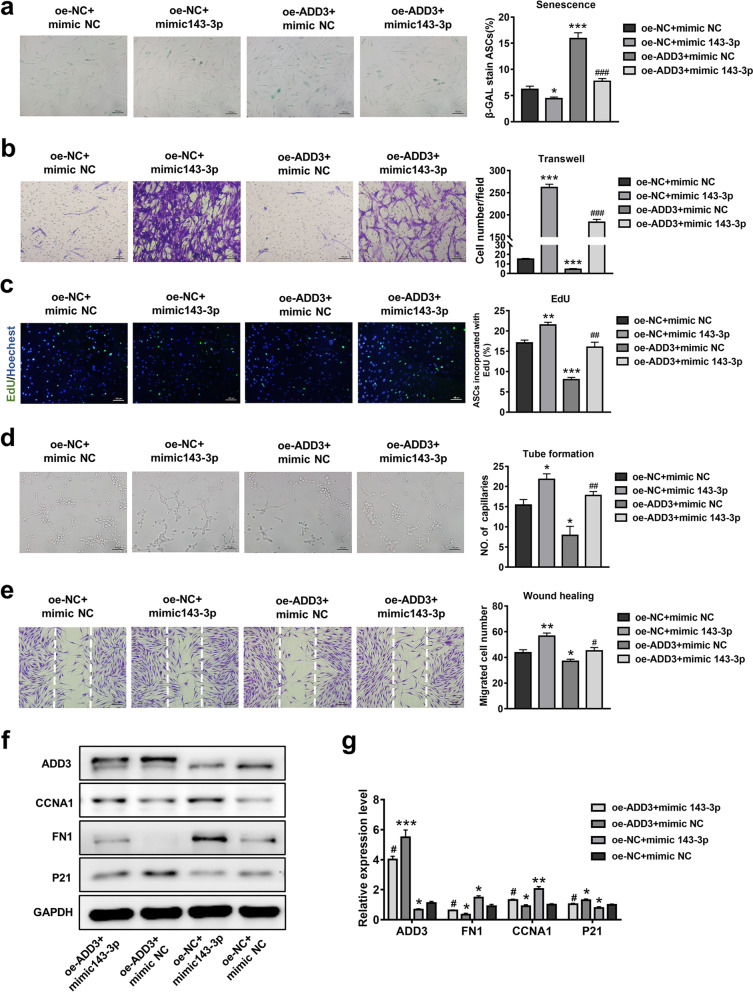
Fig. 7.
Effects of miR-143-3p and ADD3 on ASC senescence and cellular function. a β-gal staining and quantitative analysis of SA-β-gal-positive cells were performed in ASCs that had been stably transduced with empty vector (oe-NC) or ADD3 (oe-ADD3) and simultaneously transfected with miR-143-3p mimic or mimic-NC. Scale bar = 100 µm. b Images of migrated cells and quantitative analysis of ASCs that had been stably transduced with empty vector (oe-NC) or ADD3 (oe-ADD3) and simultaneously transfected with miR-143-3p mimic or mimic-NC. Scale bar = 100 µm. c Representative images and quantitative analysis of EdU-stained cells (red) in ASCs that received the above treatment; nuclei were stained blue. Scale bar = 100 µm. d Images of tube formation and analysis of HUVECs treated with CM from ASCs in the above four groups. Scale bar = 100 µm. e Images and analysis of migrated fibroblasts treated with CM as described above. Scale bar = 200 µm. f Western blotting analysis of the expression levels of p21, FN1, and CCNA1 in ASCs transduced with NC vector or SAN and simultaneously transfected with miR-143-3p mimic or mimic-NC. g Qualified data shown in f. Data are shown as the mean ± SEM. All experiments were performed in triplicate. n = 3. *p < 0.05, **p < 0.01, ***p < 0.001 versus oe-NC + mimic-NC group, #p < 0.05, ##p < 0.01, ###p < 0.001 versus oe-SAN + mimic-NC group

