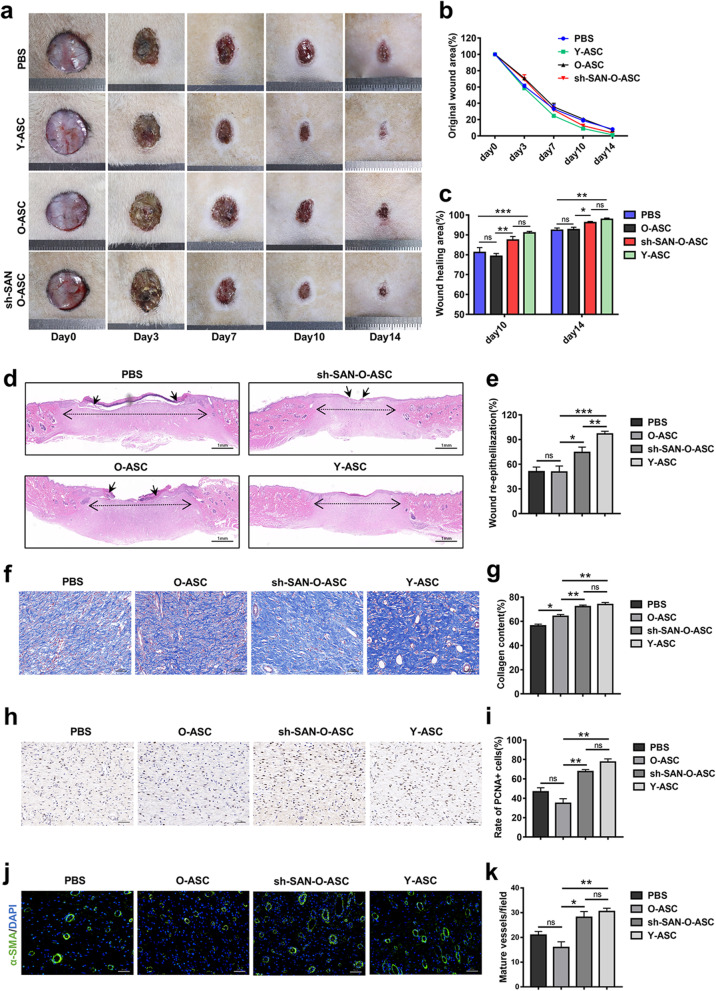
Fig. 8.
SAN-depleted O-ASCs promote wound repair capacity in vivo. a Representative images of wounds treated with PBS, Y-ASCs, O-ASCs, or sh-SAN-O-ASCs at different time points (n = 5). Images include a scale bar (ruler with basic unit of 1 mm). b Measurement of wound areas shown in (a). c Quantification of wound areas at 10- and 14-days post-wounding. d Representative hematoxylin and eosin staining analysis of skin tissues in each group at day 14 post-wounding. Single-headed arrows indicate the edge of un-epithelialized areas. Double-headed arrows indicate the edge of granulation tissue. Scale bar = 1 mm. e Qualification of the epithelialized areas shown in (d). f Representative Masson staining images and evaluation of collagen deposition in skin tissues in each group at day 14 post-wounding. Scale bar = 100 µm. g Qualification of the proportion of stained collagen shown in (f). h Immunohistochemical staining of PCNA expression in wound sections. Scale bar = 50 µm. i Enumeration and qualification of the ratio of PCNA-positive cells. j Immunofluorescent staining of skin tissues that received the above treatments at day 14 post-wounding. Smooth muscle cells (α-smooth muscle actin) and cell nuclei (DAPI) were stained green and blue. Scale bar = 50 µm. k Enumeration and qualification of mature vessels stained green. Scale bar, 100 μm. n = 4. *p < 0.05, **p < 0.01, ***p < 0.001. ns, not significant

