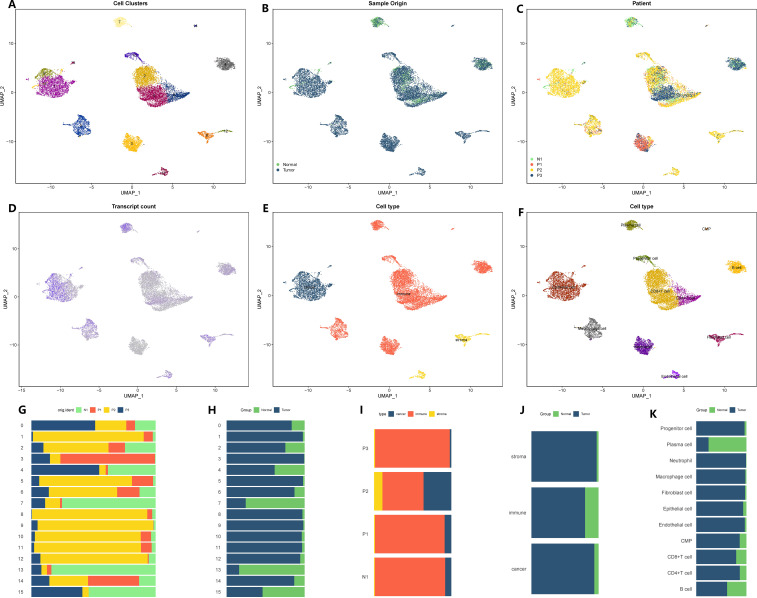
Figure 2.
Microenvironment landscape of GC and non-tumor tissues. (A) The distribution of 16 cell subsets after UMAP dimension reduction. (B) Cell distribution in GC tissues and normal gastric tissues. (C) Distribution of all cells in 4 tissue samples. (D) The gene expression of each cell-the darker the color, the higher the expression of the cell. (E) Preliminary classification of gastritis tissue. (F) Eleven cell subtypes after annotation. (G–K) The proportion of different cell division methods from different tissue/sample sources. (G) The proportion of 16 cell subsets in 4 source tissues. (H) The proportion of 16 cell subsets in GC tissues and normal gastric tissues. (I) The proportion of three microenvironment components in 4 source tissue samples. (J) The proportion of three microenvironment components in GC tissues and normal gastric tissues. (K) The proportion of eight cell subsets in GC tissues and normal gastric tissues.

