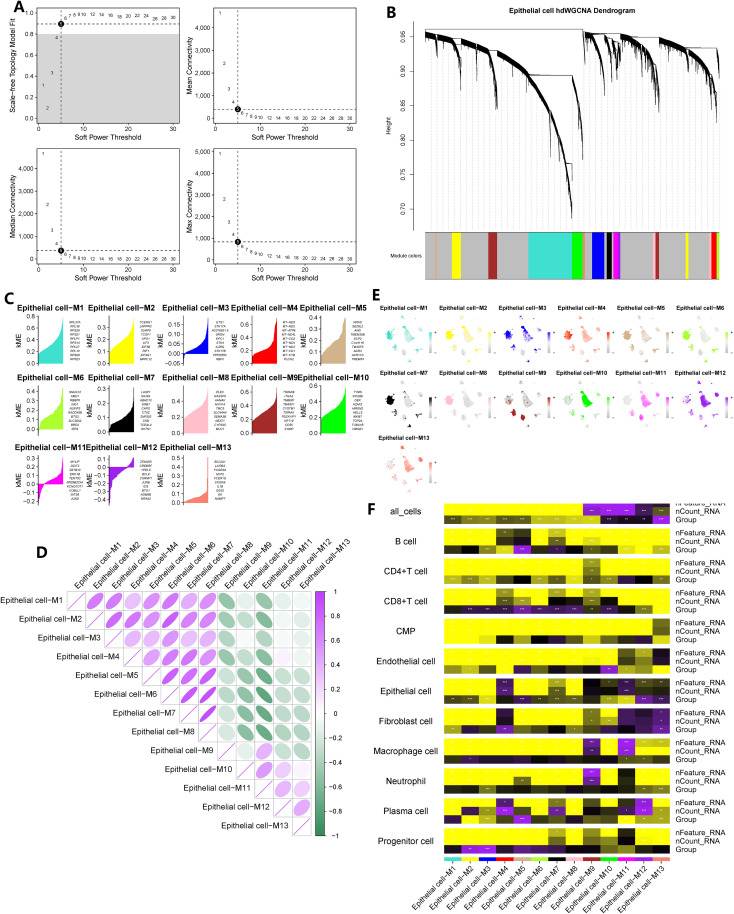
Figure 4.
hdWGCNA has identified the key epithelial cell genes in the pathogenesis of gastric cancer. (A) The selection of the optimal soft threshold. (B) Build a co-expression network based on the ideal “5” soft threshold and divide the genes into several modules to get a gene clustering tree. (C) Calculate the feature-based gene connectivity of each gene in the co-expression network analysis to determine the highly connected genes in each module. (D) Calculate gene scores for each module gene based on the UCell algorithm. (E) Correlation heatmap between modules. (F) The correlation heatmap between grouping information (GC and normal tissues) and epithelial cells. * represent P < 0.05, ** represent P < 0.01, and *** represent P < 0.001.

