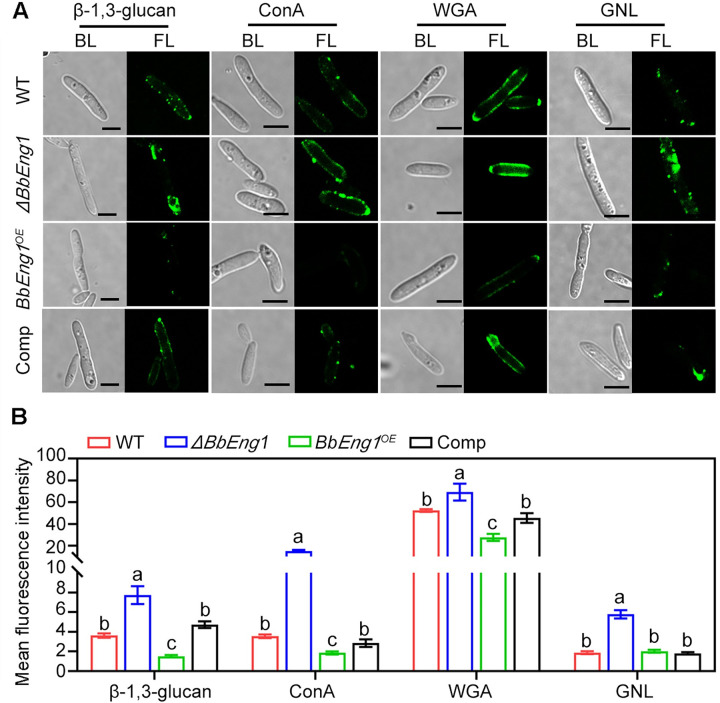
Fig 6. Carbohydrate epitopes and β-1,3-glucan levels on surfaces of B. bassiana wild type and mutant hyphal bodies.
A. Fluorescence images (scale: 5 μm) of hyphal bodies treated with monoclonal β-1,3-glucan specific antibody and goat anti-mouse IgG-FITC and Fluor 488-labeled lectins. BL, bright light. FL, fluorescent light. B. Mean fluorescence levels quantified from at least 100 individual cells of tested strains. Error bars: SDs. Different letters indicate significant differences (P < 0.01 in LSD test).

