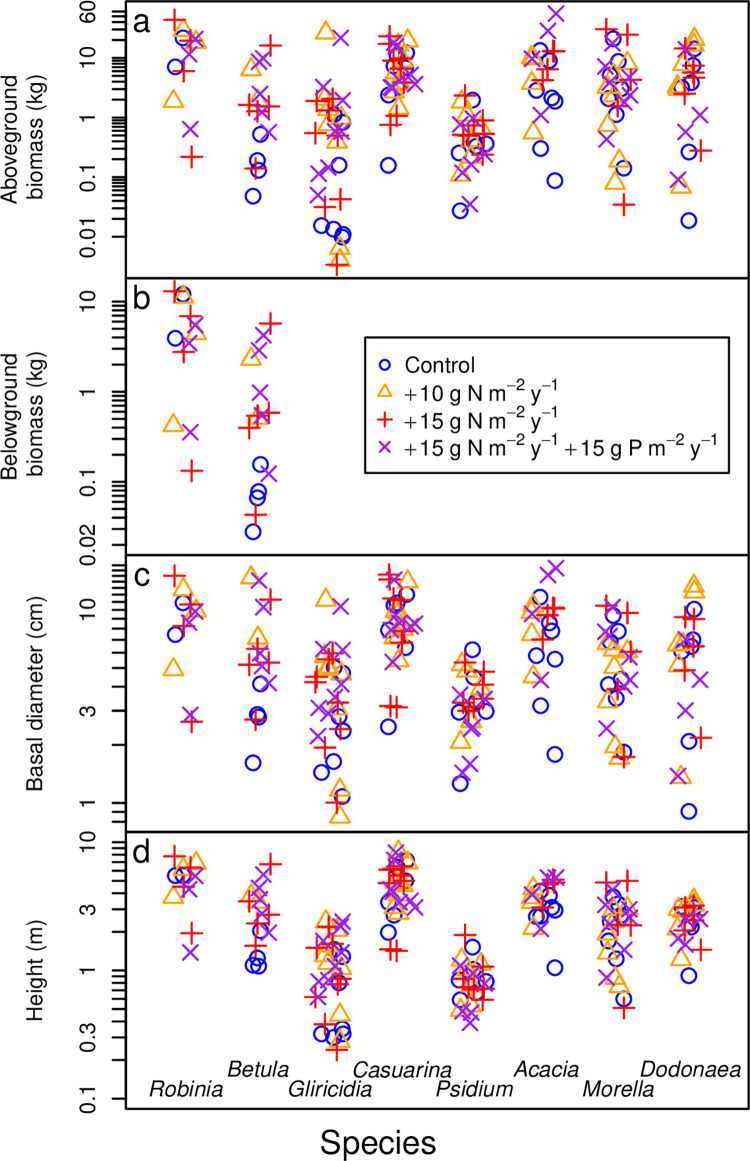
Fig 1. Size distributions of eight tree species.
(a) Aboveground biomass, (b) belowground biomass, (c) basal diameter, and (d) height are shown for each species. Each symbol represents one individual tree. Color and symbol indicate the fertilization treatment, as indicated in the legend. Data were jittered horizontally for visual clarity. Vertical dotted lines separate the points to clarify which points correspond to which species.

