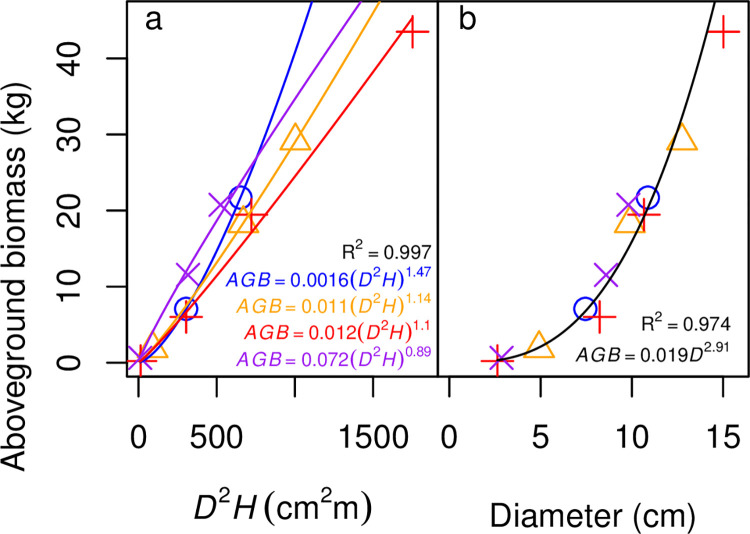
Fig 4. Models for aboveground biomass (AGB) of Robinia pseudoacacia.
(a) The best fit model according to AIC, which models aboveground biomass as a function of the square of basal diameter (D, in cm) multiplied by height (H, in m), with different parameters for each treatment. Colors and symbols of the points indicate treatments, as in Fig 1. Colors of curves are analogous: blue is the control; orange is the +10 g N m−2 y−1 treatment; red is the +15 g N m−2 y−1 treatment; and purple is the +15 g N m−2 y−1 +15 g P m−2 y−1 treatment. (b) Aboveground biomass as a function of basal diameter (D) only. Colors and symbols of the points indicate treatments, as in Fig 1. The fit is shown in black because it does not depend on treatment. The fits shown on the panels are the same as in Tables 3 and 6.

