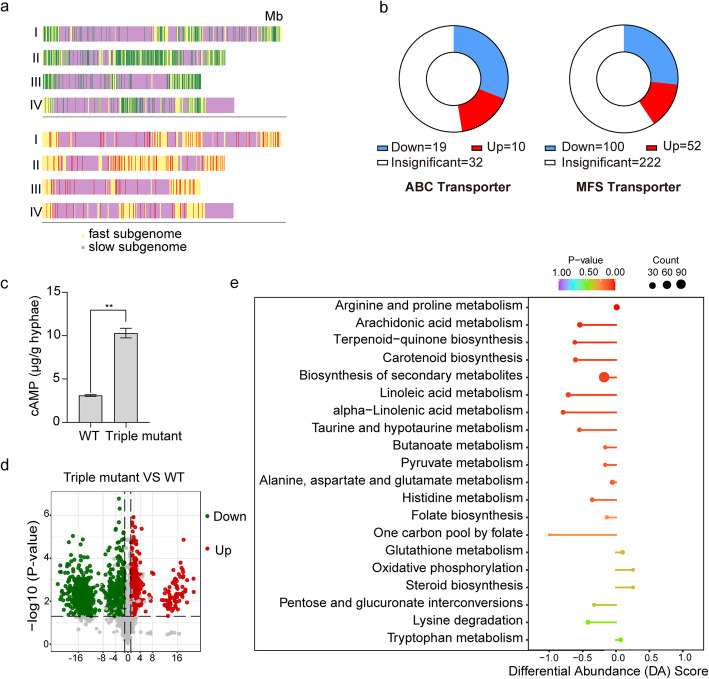
Fig. 5.
RNA-seq analysis and metabolome profiling of the wild type and Gpmk1 mgv1 Fghog1 triple mutant. a. Distribution of up-regulated (red) and down-regulated (green) DEGs in the triple mutant on chromosomes I to IV. Each vertical line represents the chromosomal position of a specific DEG. Yellow and purple region represent the fast and slow subgenomic regions of F. graminearum, respectively. b. Expression patterns of all the predicted ABC and MFS transporter genes in the wild type and triple mutant. Up and down indicate the ones that were up- or down-regulated in the triple mutant. c. The intracellular cAMP level in the wild type and triple mutant. d. A volcano plot of the 407 and 806 metabolites that were significantly increased (red dots) and decreased (green dots), respectively, in the triple mutant in comparison with the wild type. e. KEGG enrichment analysis of differentially accumulated metabolites related to listed metabolic pathways. The differential abundance (DA) score reflects the quantitative change of metabolites in the triple mutant (−, decreased; + increased) compared to the wild type. The sizes of the circles represent the number of differentially accumulated metabolites in each metabolism pathway. Distance between the circle and the center point represent the range of variation

