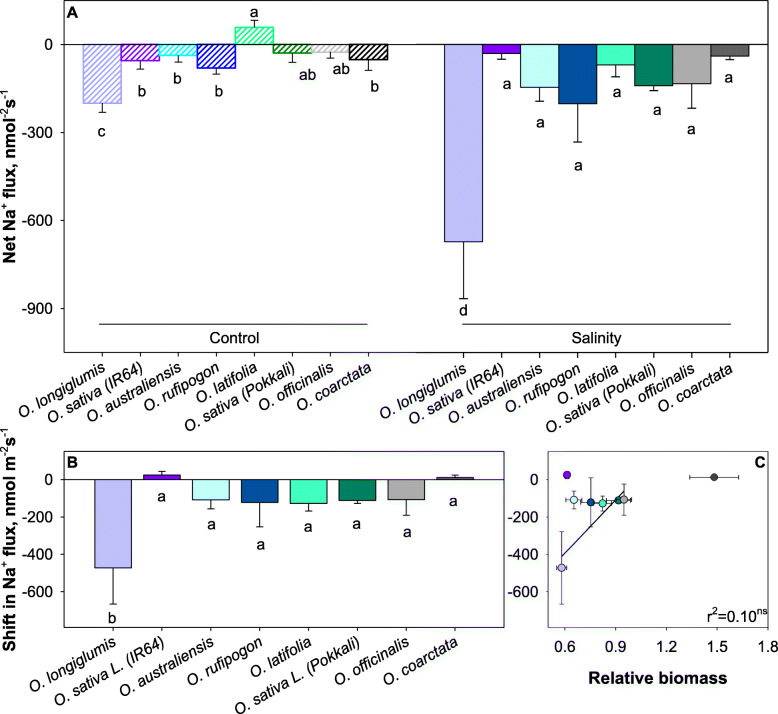
Fig. 3.
Linking salinity tolerance of wild and cultivated rice to net Na+ ion fluxes of mesophyll cells. Salinity treatment was applied at 100 mM NaCl for 42 days. (A). Shift in K+ flux was the flux difference between flux from salinity stressed and control samples (B). Pearson analysis of shift in Na+ flux with relative biomass (C). Data are mean values and the error bars indicate the standard errors. Different lowercase letters indicate significant differences at P < 0.05 for each Duncan group

