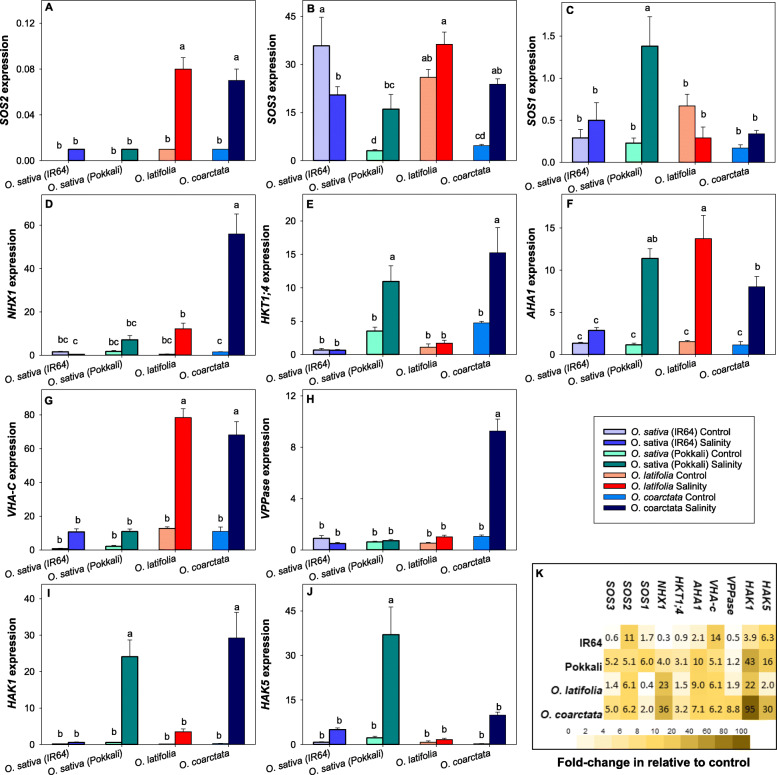
Fig. 7.
Expression of salinity tolerance-related genes in the leaf of wild and cultivated rice after 42 days of 100 mM NaCl treatment. (A) SOS2, (B) SOS3, (C) SOS1, (D) NHX1, (E) HKT1;4, (F) AHA1, (G) VHA-C, (H) VPPase, (I) HAK1 and (J) HAK5. (K) Fold change of genes after salinity treatment is relative to the control. Data are mean of 3 technical replicates (each containing at least 3 technical replicates) and the error bars indicate the standard errors. Different lowercase letters indicate significant differences at P < 0.05 for each Duncan group

