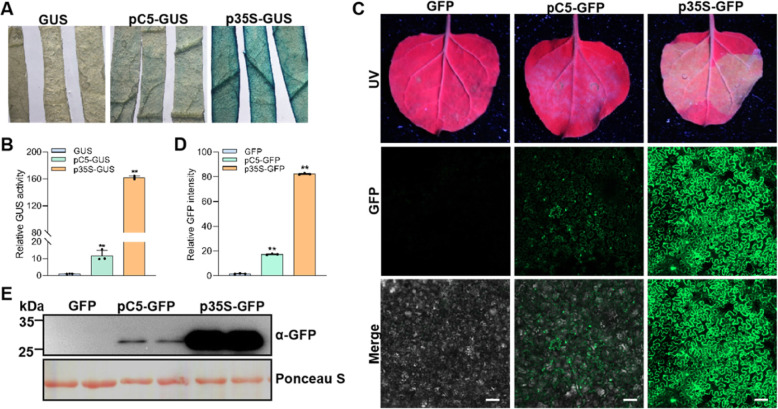
Fig. 2.
Expression of GUS and GFP can be driven by the C5 promoter sequence. A The activity of the promoter sequence of C5 analyzed by GUS staining; the 35S promoter is used as positive control. B Quantification of relative GUS activity in samples from (A). Data are the mean of three independent biological replicates. Error bars represent SD (n = 3). C The C5 and 35S promoters drive the expression of GFP. The GFP fluorescence was observed in transiently transformed N. benthamiana leaves at 2 dpi using confocal microscope. Bar: 100 μm. D Quantification of relative GFP intensity in samples from (C). The intensity of GFP fluorescence was measured with the ZEN3.1 software with the method of mean intensity in the same area. E Western blot analysis of total protein extracted from (C) with anti-GFP antibodies. Ponceau S staining of the large RuBisCO subunit serves as loading control. This experiment was repeated three times with similar results; representative results were shown

