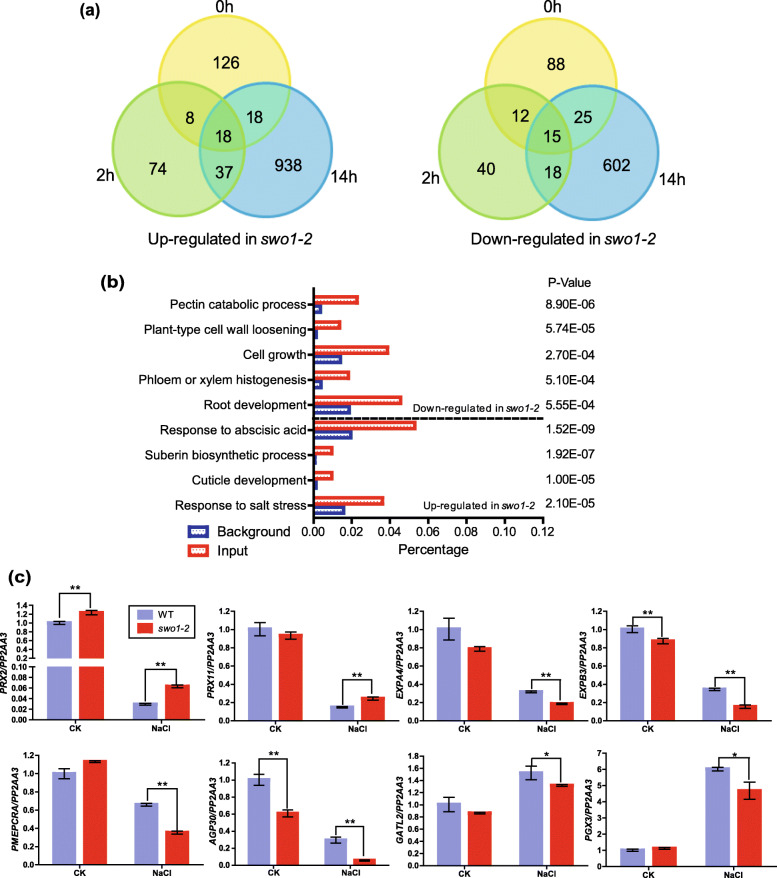
Fig. 5.
SWO1 regulates cell wall-related gene expression under saline conditions. (a) Venn diagrams show the numbers of up-regulated (left panel) and down-regulated (right panel) genes in swo1–2 roots after salt treatment for 0, 2, and 14 h. (b) GO enrichment analysis of the differentially expressed genes (DEGs) in the swo1–2 after salt treatment for 14 h. (c) qRT-PCR analysis of DEGs involved in ROS generation and regulation, cell wall modification and pectin biosynthesis in the swo1–2 under salt treatment. PP2AA3 was used as the internal control. Values are means ± SD (n = 3). **P < 0.01 and *P < 0.05 (Student’s t test)

