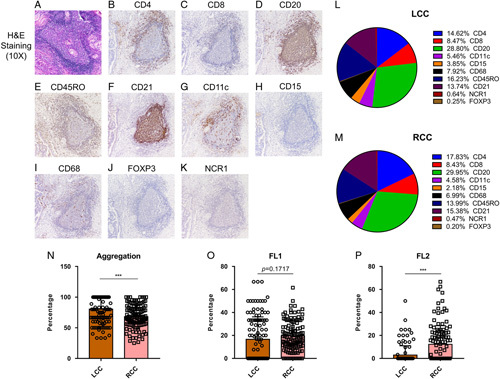
Figure 2.

H&E sections showing TLS and different immune cells in TLS. (A) Representative figure of H&E slides to show TLS. (B-K) IHC results showed the different immune cells, which formed the TLS, including (B) CD4+ T cells, (C) CD8+ T cells, (D) CD20+ B cells, (E) CD45RO+ memory T cells, (F) CD21+ follicular dendritic cells, (G) CD11c+ dendritic cells, (H) CD15+ granulocytes, (I) CD68+ macrophages, (J) FOXP3+ Treg cells, and (K) NCR1+ natural killer cells. (L and M) Pie chart figure showed the distribution of various immune cells forming the TLS between LCC and RCC. (N–P) Scatter plots showed different TLS maturity status between LCC and RCC. LCC, left-sided colon cancer; RCC, right-sided colon cancer.
