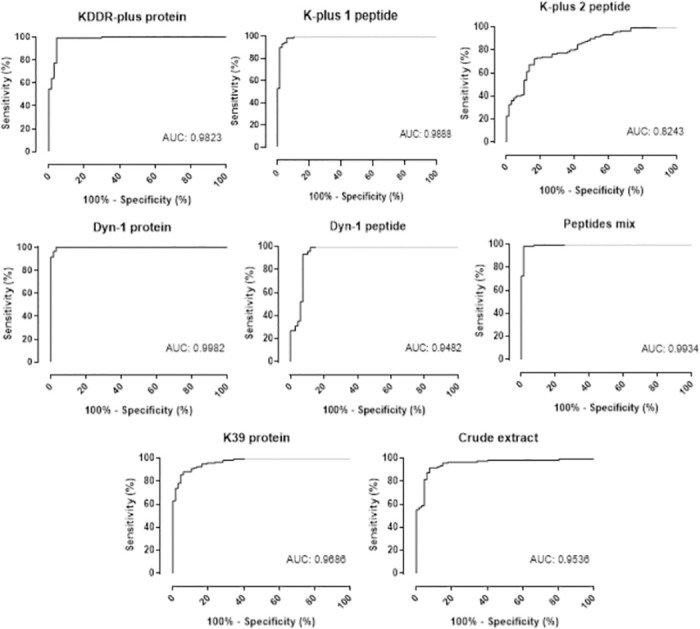
Fig 7. ROC curve analysis of the area under the curve (AUC), considering the results from ELISA.

Comparation of the ROC curve obtained employing Leishmania complete recombinant proteins Dyn-1 and KDDR-plus, the synthetic peptides derived from each recombinant protein (Dyn-1, K-plus 1 and K-plus 2 peptides), a mixture (Mix peptides) of 0.3 μg/well of the three peptides and control antigens rK39 and crude extract was established by GraphPad Prism 8.0 using serum samples of negative and positive samples in each plate. Abbreviations: (AUC) area under curve.
