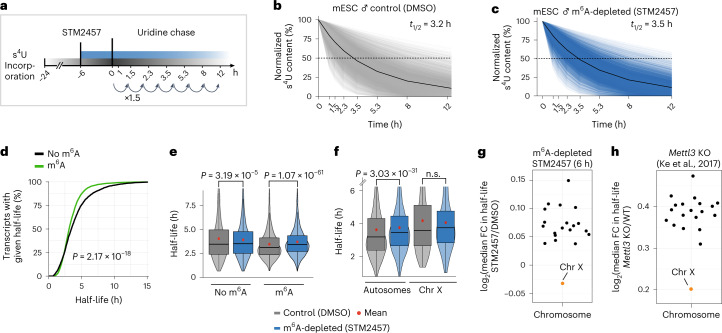
Fig. 1. X-chromosomal transcripts are more stable upon m6A depletion.
a, Experimental setup for the SLAM-seq experiment. b,c, Transcripts (n = 7,310) in control (b) and m6A-depleted conditions (c) show a median half-life (t1/2) of 3.2 h and 3.5 h, respectively (P value = 5.25 × 10⁻²⁹, two-tailed Wilcoxon signed-rank test). Median s4U content for all transcripts is shown in black. d, Transcripts with m6A sites have significantly shorter half-lives (P value = 2.17 × 10⁻¹⁸, two-tailed Wilcoxon rank-sum test). Cumulative fractions of transcripts with given half-lives for transcripts with (n = 2,342, green) or without (n = 4,967, black) m6A sites. e, Transcripts with m6A sites (n = 2,342) significantly increase in half-life upon m6A depletion (8% median increase, P value = 1.07 × 10–61, two-tailed Wilcoxon signed-rank test), unmethylated transcripts (n = 4,967) were largely unaffected (0.3% median decrease, P value = 3.186 × 10⁻⁵) (same gene set in both conditions). The mean half-life in each group is shown as a red dot. Boxes represent quartiles, center lines denote medians, and whiskers extend to most extreme values within 1.5 × interquartile range. f, Half-lives of autosomal transcripts significantly increase upon m6A depletion (P value = 3.03 × 10⁻³¹, two-tailed Wilcoxon signed-rank test), while X-chromosomal transcripts remain unchanged (P value = 0.2121, two-tailed Wilcoxon signed-rank test). Distribution of half-lives for autosomal (n = 7,069) and X-chromosomal transcripts (n = 241) (same gene set in both conditions). The mean half-life in each group is shown as a red dot. Boxes are as in e. g, Median fold change (FC) in mRNA half-lives (log2) for each chromosome in m6A-depleted (STM2457) over control (DMSO) conditions. X-chromosomal transcripts show the lowest half-life increase upon m6A depletion (P value = 0.005486, mean difference in log2(fold change) values = –0.0945, linear mixed model, two-tailed t-test on fixed effects, see Methods). h, Median fold change (log2) in mRNA half-lives for each chromosome in Mettl3 KO over WT mESCs34 (P value = 0.000225, X-chromosomal versus autosomal transcripts, mean difference in log2-transformed fold changes = −0.22057). The absolute differences between m6A depletion and Mettl3 KO conditions may result from differences in the experimental setup, including the mode of Mettl3 inactivation and the method used to determine transcript half-lives.

