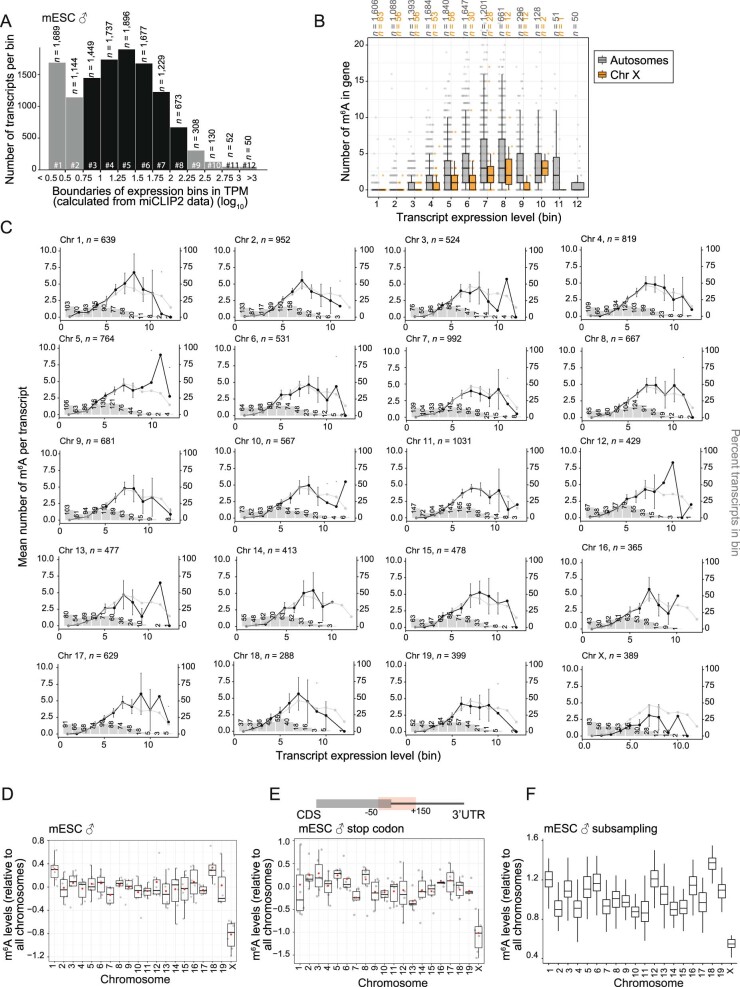
Extended Data Fig. 6. X-chromosomal transcripts harbour less m6A sites than autosomal transcripts in male mESC.
a. Transcripts were stratified into 12 bins (#1–12) according to their expression in male mESC (transcripts per million [TPM, log10], see Methods). x-axis depicts boundaries between bins (in TPM). Bin number (#) and number of transcripts therein are given below and above each bar, respectively. Bins #3–8 that were used for quantifications of m6A sites per transcripts are highlighted in black. b. Quantification of m6A for each transcript in the different expression bins of autosomal (grey) and X-chromosomal (orange) transcripts. Boxes represent quartiles, centre lines denote medians, and whiskers extend to most extreme values within 1.5× interquartile range. c. Quantification of m6A sites per transcript for all mouse chromosomes. Data points indicate mean number of m6A sites per transcript and 95% confidence interval (left y-axis) in each expression bin (x-axis, bins as defined in a) for all chromosomes (chromosome name and total number of expressed transcripts given above). Grey bars indicate the percentage of transcripts in each expression bin (right y-axis) relative to all expressed transcripts on the chromosome. Absolute numbers of transcripts in each bin are given above the bars. Only genes with a mean TPM > 1 over all samples were considered. d. Fold change (log2, grey dots) in mean m6A sites per transcripts for expression bins #3–8 (n of mean of expression bins = 6) on an individual chromosome over the mean m6A sites per transcripts across all chromosomes. Red dots indicate mean fold change of the six bins on the given chromosome. Boxes as in b. e. Same as d. using only m6A sites in a fixed window around stop codons (−50 nt to +150 nt) to exclude confounding effects of transcript length differences. Boxes as in b. f. Same as c. after randomly subsampling n = 30 genes from expression bins #3–5 to exclude potential biases from different numbers of transcripts in the expression bins for each chromosome. Shown is the distribution of mean m6A sites per transcript for each chromosome from 100 repeats of subsampling. Boxes as in b.

