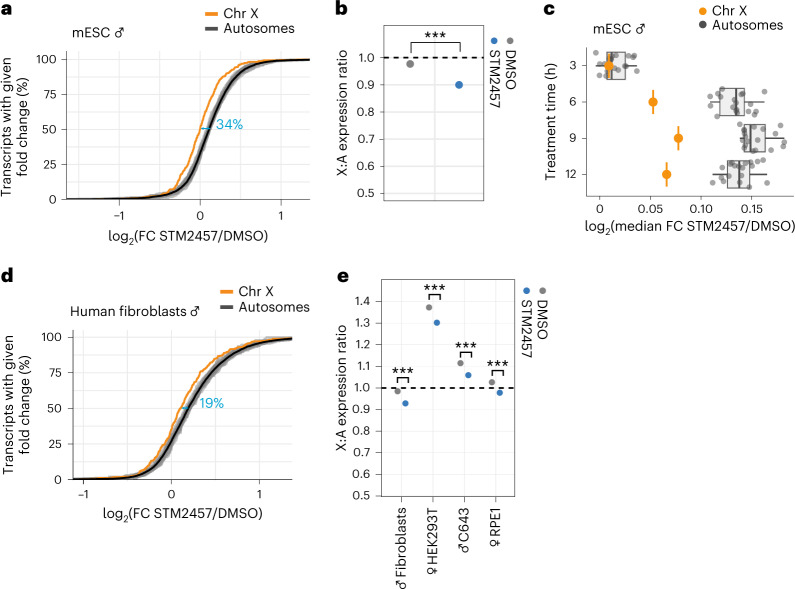
Fig. 2. X-chromosomal transcripts are more stable and less upregulated upon m6A depletion.
a, X-chromosomal transcripts are less upregulated upon m6A depletion in male mESCs (P value = 1.86 × 10⁻¹⁷, two-tailed Wilcoxon rank-sum test). The cumulative fraction of transcripts (RPKM > 1) on individual autosomes (gray) and the X chromosome (orange) that show a given expression fold change (log2, RNA-seq) upon m6A depletion (STM2457, 24 h). Mean expression changes for all autosomes are shown as a black line. Effect sizes (blue) show the shift in medians, expressed as percentage of the average interquartile range (IQR) of autosomal and X-chromosomal genes (see Methods). b, X:A expression ratios show a significant reduction upon m6A depletion (P = 1.4 × 10⁻¹⁵, two-tailed t-test of linear contrasts in mixed effect Gaussian model in log scale). c, Differential effects on autosomal and X-chromosomal transcripts already occur after 6 h of m6A depletion. Median fold changes (log2) of transcripts from autosomes (n = 19, gray) and the X chromosome (n = 1, orange) estimated by RNA-seq at different time points of m6A depletion (STM2457, 3, 6, 9 and 12 h). Boxes represent quartiles, center lines denote medians, and whiskers extend to most extreme values within 1.5 × interquartile range. d, Same as a, for human primary fibroblasts (STM2457, 9 h). P value = 6.24 × 10⁻⁶, two-tailed Wilcoxon rank-sum test. Effect sizes are shown as the shift in medians of the two distributions, expressed as percentage of the average IQR of autosomal and X-chromosomal genes (see Methods). e, Same as b, for human cell lines (P value = 0.0000803 (human fibroblasts), P value = 0.0000379 (HEK293T), P value = 0.0003284 (C643), P value = 0.0002982 (RPE1). P values were calculated as in a, with multiple testing correction.

