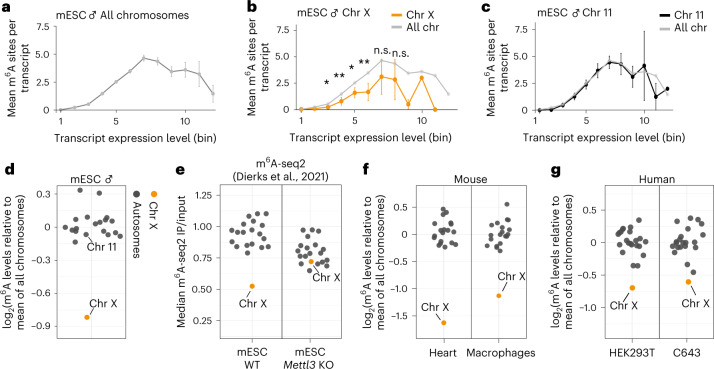
Fig. 3. m6A sites are reduced on transcripts from the X chromosome.
a, The number of detected m6A sites varies with expression level. Mean m6A sites per transcript were quantified for transcripts in each expression bin (n = 12,034 transcripts, see Extended Data Fig. 6a for n in each bin). Error bars indicate the 95% confidence interval. b, X-chromosomal transcripts harbor fewer m6A sites across expression levels. Transcripts from the X chromosome (orange, n = 389 transcripts) compared with the mean of all chromosomes (gray). The numbers of transcripts in expression bins are shown in Extended Data Figure 6c. Significance values for bins 3–8 are indicated by asterisks (autosomes versus X chromosome, two-tailed Wald tests in a generalized linear model for negative binomial data, multiple testing correction; n.s., not significant; *P value < 0.05, **P value < 0.01). c, The m6A content of transcripts from chromosome 11 (n = 1,031 transcripts) follows the mean of all chromosomes across all expression levels. Transcripts from chromosome 11 (black) compared with the mean of all chromosomes (gray). Analyses for individual chromosomes are shown in Extended Data Figure 6c. d–g, X-chromosomal transcripts have significantly fewer m6A sites in male mESCs (P = 4.1 × 10⁻⁹, generalized linear model for negative binomial data) (d), published m6A-seq2 data from mESCs36 (e), mouse heart samples (P = 8.34 × 10⁻¹¹) and macrophages (P value = 1.38 × 10⁻⁸) (f), and human HEK293T (P = 0.000203) and C643 cell lines (P value = 0.001030) (g). Mean fold change (log2) of m6A sites per transcript on respective chromosomes relative to all chromosomes (Extended Data Fig. 6d). For mouse data, transcripts of intermediate expression (bins 3–8) are used. For HEK293T data, bins 4–9 were used, and for C643 data, bins 5–10 were used. X-chromosomal and autosomal transcripts are shown in gray and orange, respectively. Chromosomes 11 and X are labeled, for comparison with b and c. P values for comparisons of autosomal versus X-chromosomal transcripts are as in b.

