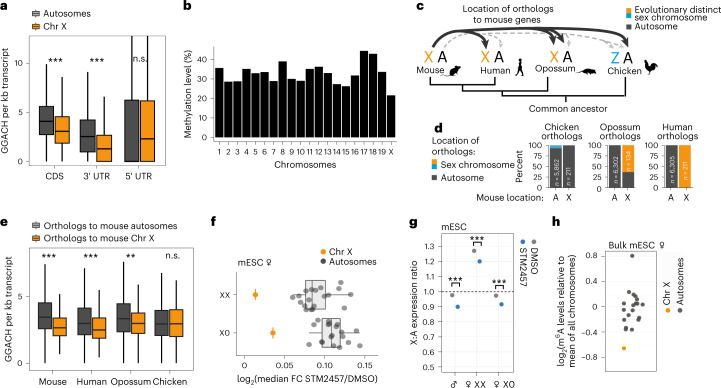
Fig. 4. Reduced m6A levels on X-chromosomal transcripts are intrinsically encoded.
a, GGACH motifs (normalized to region length) in different transcript regions of autosomal (gray) and X-chromosomal transcripts (orange) in mouse (P value = 1.38 × 10⁻²⁹ (CDS, n = 16,631 annotations), P value = 1.06 × 10–40 (3′ UTR, n = 16,484 annotations) and 0.2707 (5′ UTR, n = 16,490 annotations), two-tailed Wilcoxon rank-sum test). b, Methylation levels of GGACH motifs are slightly reduced on X-chromosomal transcripts. Fraction of m6A sites per chromosome with methylation in miCLIP2 data from male mESCs. Boxes represent quartiles, center lines denote medians, and whiskers extend to most extreme values within 1.5 × interquartile range. c, Location of mouse X-chromosomal orthologs in human, opossum (Monodelphis domestica), and chicken. d, Percentage of orthologs of X-chromosomal or autosomal genes in mouse that are located on autosomes or sex chromosomes in human, opossum, and chicken. e, GGACH motifs in transcripts (exons) from mouse genes and corresponding orthologs in chicken, opossum, and human (n = 6,520). Orthologs to mouse X-chromosomal and autosomal genes are indicated in orange and gray, respectively (two-tailed Wilcoxon rank-sum test, *P value < 0.05, **P value < 0.01, ***P value < 0.001, P value = 1.2 × 10⁻¹⁸ (mouse), 2.7 × 10⁻⁶ (human), 0.001227 (opossum), 0.8602 (chicken)). Boxes are as in a. f, Effects of m6A depletion on expression of autosomal and X-chromosomal transcripts in XX and X0 clones of female mESCs (P value = 1.64 × 10⁻¹² and 3.5 × 10⁻¹¹, respectively, two-tailed Wilcoxon rank-sum test, Extended Data Fig. 9a–c). Median fold changes (log2) of transcripts from autosomes (n = 19, gray) and the X chromosome (n = 1, orange), estimated by RNA-seq after m6A depletion (STM2457, 9 h). Boxes are as in a. g, X:A expression ratios are significantly reduced upon m6A depletion (P value = 4.12 × 10⁻¹⁵ (mESC), P value = 2.06 × 10⁻¹¹ (female mESC XX), P value = 1.08 × 10⁻¹⁰ (female mESC X0). P values are as in Figure 2b, multiple testing correction). h, Median fold change (log2) of m6A sites per transcript on each chromosome relative to all chromosomes (P = 0.0018, autosomal (gray) versus X-chromosomal (orange) transcripts, two-tailed Wald test in generalized linear mixed model for negative binomial data).

