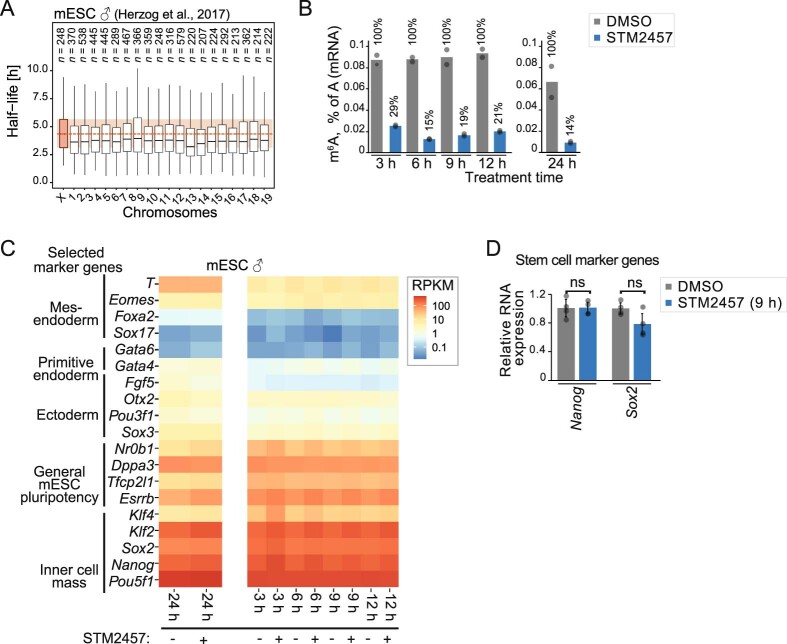
Extended Data Fig. 1. Mettl3 inhibitor treatment of mouse embryonic stem cells (mESC) depletes m6A levels.
a. X-chromosomal transcripts are more stable than autosomal transcripts (median half-life = 3.72 h [autosomes] vs. 4.35 h [X chromosome], P value = 1.02e-05, two-sided Wilcoxon rank-sum test). Distribution of half-lives from published SLAM-seq data for mESC for transcripts on each individual chromosome. Dashed red line and red box indicate median and inter-quartile range of X-chromosomal transcripts, respectively, for comparison. Boxes represent quartiles, centre lines denote medians, and whiskers extend to most extreme values within 1.5× interquartile range. b. Time course experiments shows that treatment of male mESC with the Mettl3 inhibitor (STM2457, 20 µM) results in a gradual reduction of m6A levels on mRNAs. m6A levels were measured by liquid chromatography-tandem mass spectrometry (LC-MS/MS) for poly(A) + RNA from m6A-depleted (STM2457, 3–24 h) and control conditions. Quantification of m6A as percent of A in poly(A) + RNA. n = 2 independent biological replicates. c. Expression levels of marker genes confirm the pluripotent state of the male mESC throughout the time course experiment. Gene expression levels (RNA-seq) are shown as reads per kilobase of transcript per million mapped reads (RPKM, mean over all replicates, log10) in m6A-depleted (STM2457, 3–24 h) and control conditions. d. Quantitative real-time PCR (qPCR) to quantify expression changes of stem cell marker genes in m6A-depleted (STM2457, 9 h) and control conditions. Normalised CT values (∆CT, normalised to Gapdh expression) are compared between conditions. Fold changes are displayed as mean s.d.m., two-sided Student’s t-test on log2-transformed data, n = 4 independent biological samples, ns, not significant. P value = 0.8 [Sox2]; 0.96 [Nanog].

