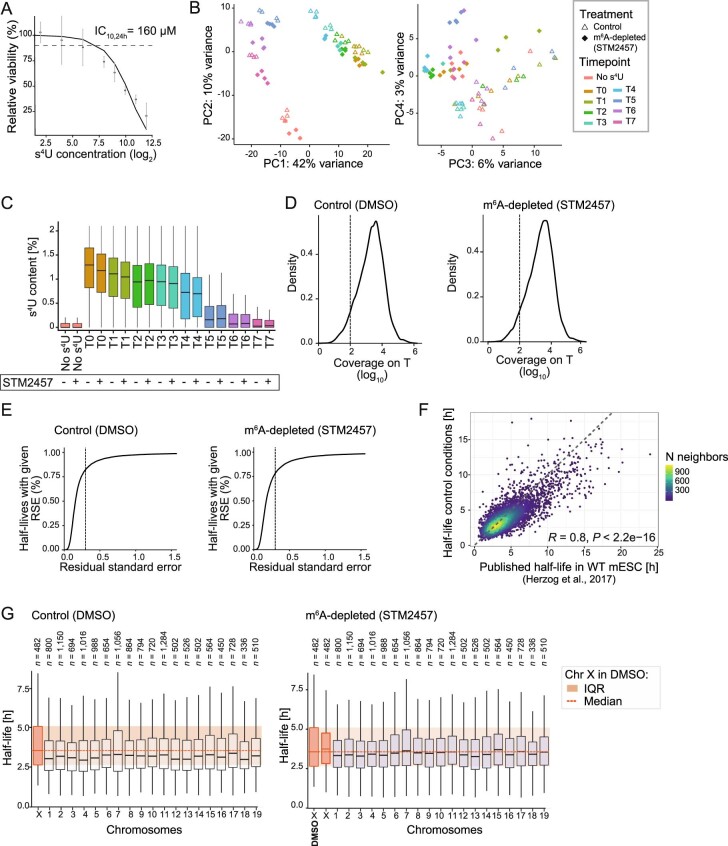
Extended Data Fig. 2. SLAM-seq measures mRNA half-lives in mESC.
a. Cell viability assessed for male mESC cultured with s4U for 2 ± 4 h in varying concentrations (x-axis, log2-transformed). Viability of labelled cells in relation to unlabelled cells is shown as mean ± s.d.m., n = 3 biologically independent samples. IC10,24h is indicated as dashed line. b. Principal component analysis of SLAM-seq replicates based on numbers of reads with T-to-C conversions. Principal component (PC) 1 and PC2 (left) separate the different timepoints of the experiment (colours), PC3 and PC4 (right), separate control and m6A-depleted conditions (symbols). c. T-to-C conversions on T’s by the overall T coverage per 3′ UTR. Maximum s4U rate is achieved after 24 h of labelling (T0) and steadily decreases after s4U washout and uridine chase (T1-T7). Unlabelled samples (No s4U) are shown for comparison. n = 21,527 UTRs with incorporation rates per replicate. Boxes represent quartiles, centre lines denote medians, and whiskers extend to most extreme values within 1.5× interquartile range. d. Expression estimates based on log10-transformed coverage on T’s per 3′ UTR (mean over all replicates and timepoints per condition). Only 3′ UTRs with SLAM-seq reads covering at least 100T’s (indicated by dotted line) were used for subsequent fitting. e. Cumulative distribution of the goodness-of-fit (residual standard error, RSE) of half-lives calculated from SLAM-seq data. Dotted lines indicate filtering cut-off (RSE > 0.3). f. Correlation of half-lives determined in this study (male mESC, control condition) with previously published half-lives in male mESC (two-sided Pearson correlation coefficient [R] = 0.8, P value < 2.2e-16). g. Distribution of half-lives of transcripts on individual chromosomes in control (left) or m6A-depleted conditions (right). In control conditions, half-lives of X-chromosomal transcripts differ significantly from autosomal transcripts (median half-life 3.19 h [autosomes] vs. 3.57 [X chromosome], P value = 7.63e-05, two-sided Wilcoxon rank-sum test). In m6A-depleted conditions, autosomal transcript half-lives approximate X-chromosomal transcript half-lives in control conditions (P value = 0.06228, two-sided Wilcoxon rank-sum test). Red lines and boxes indicate median and interquartile range, respectively, of half-lives of X-chromosomal transcripts in control conditions. Boxes as in c.

