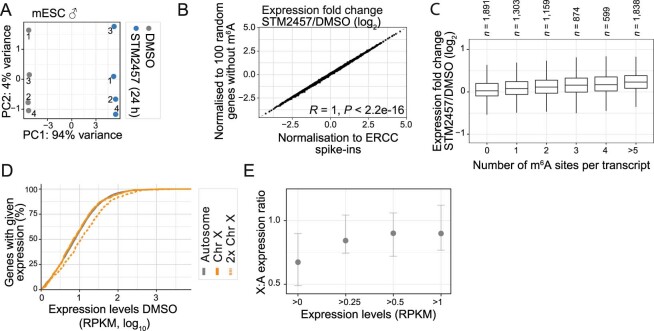
Extended Data Fig. 3. RNA-seq upon m6A depletion reveals upregulation of autosomal but not X-chromosomal transcripts.
a. Principal component analysis indicates high reproducibility of RNA-seq data for male mESC in control and m6A-depleted conditions (STM2457, 24 h, 4 replicates per condition, total of 398 million uniquely mapped reads). Replicate number given next to each data point. b. Correlation of expression fold changes (log2) of RNA seq data in m6A-depleted (STM2457, 24 h) over control conditions using normalisation to ERCC spike-ins (x-axis) or 100 randomly chosen genes without m6A sites (y-axis, see Methods; two-sided Pearson correlation coefficient [R] = 1, P value < 2.2e-16). c. Upregulation upon m6A depletion increases with the number of m6A sites in the transcripts. Distribution of fold changes (log2) in m6A-depleted (STM2457, 24 h) over control conditions in expressed transcripts (transcripts per million [TPM] > 1, based on total miCLIP2 signal) stratified by their number of m6A sites. Numbers of transcripts in each category are indicated above. Boxes represent quartiles, centre lines denote medians, and whiskers extend to most extreme values within 1.5× interquartile range. d. Cumulative distribution of expressed autosomal (grey) and X-chromosomal (orange) transcripts (RPKM > 1) with a given expression level (RPKM, x-axis). The expression distributions of X-chromosomal and autosomal transcripts are largely identical, supporting a X:A ratio close to 1 across the full expression range. For comparison, a theoretical doubling of the X-chromosomal expression is shown (orange, dotted) which would exceed autosomal expression levels. e. Median X-to-autosome (X:A) expression ratios increase with higher RPKM cut-offs (>0, n [genes] = 26,291, ≥0.25, n = 13,795, ≥0.5, n = 12,255, ≥1, n = 10,849). Median X:A ratios for male mESC and 95% confidence intervals are given.

