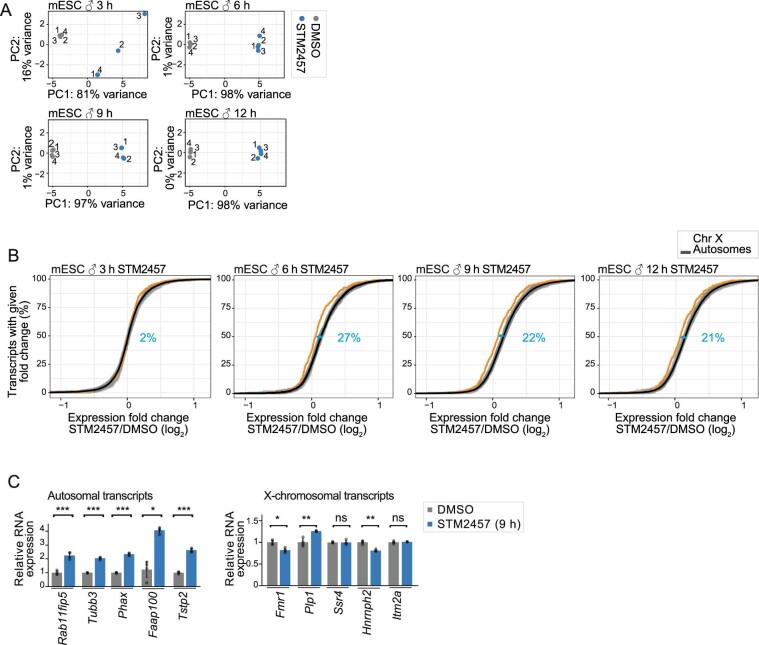
Extended Data Fig. 4. Time-course RNA-seq upon m6A depletion reveals upregulation of autosomal genes after 6 h of inhibitor treatment.
a. Principal component analyses of RNA-seq replicates of control and m6A-depleted male mESC at different time points (STM2457, 3–12 h) based on numbers of reads or the 500 genes with highest variance across all samples for a given time point. Replicate number given next to each data point. b. After 6 h of m6A depletion, X-chromosomal transcripts show significantly lower fold changes (log2) compared to autosomal transcripts (P value = 0.48 [3 h], P value = 1.02e-12 [6 h], P value = 5.12e-10 [9 h], P value = 1.69e-08 [12 h], two-sided Wilcoxon rank-sum test). Cumulative fraction of transcripts on individual autosomes (grey) and the X chromosome (orange) that show a given expression fold change (log2, RNA-seq) at different timepoints of m6A depletion (STM2457, 3–12 h) in male mESC. Mean expression changes for all autosomes are shown as black line. Effect sizes (blue) show the shift in medians, expressed as percent of the average interquartile range (IQR) of autosomal and X-chromosomal genes (see Methods). c. qPCR to quantify expression changes of five autosomal (left) and five X-chromosomal (right) transcripts in control and m6A-depleted (STM2457, 9 h) male mESC cells. Normalised CT values (∆CT, normalised to Gapdh expression) are compared between conditions. Fold changes are displayed as mean ± s.d.m., two-sided Student’s t-test on log2-transformed data, n = 4 biologically independent samples, *P value < 0.05, **P value < 0.01, ***P value < 0.001, ns, not significant. P value = 0.00017 [Rab11fip5], 8.57e-07 [Tubb3], 8.08e-08 [Phax], 0.049 [Faap100], 1.46e-06 [Tstp2]; 0.56 [Itm2a], 0.001 [Hnrnph2], 0.95 [Ssr4], 0.007 [Plp1], 0.01 [Fmr1].

