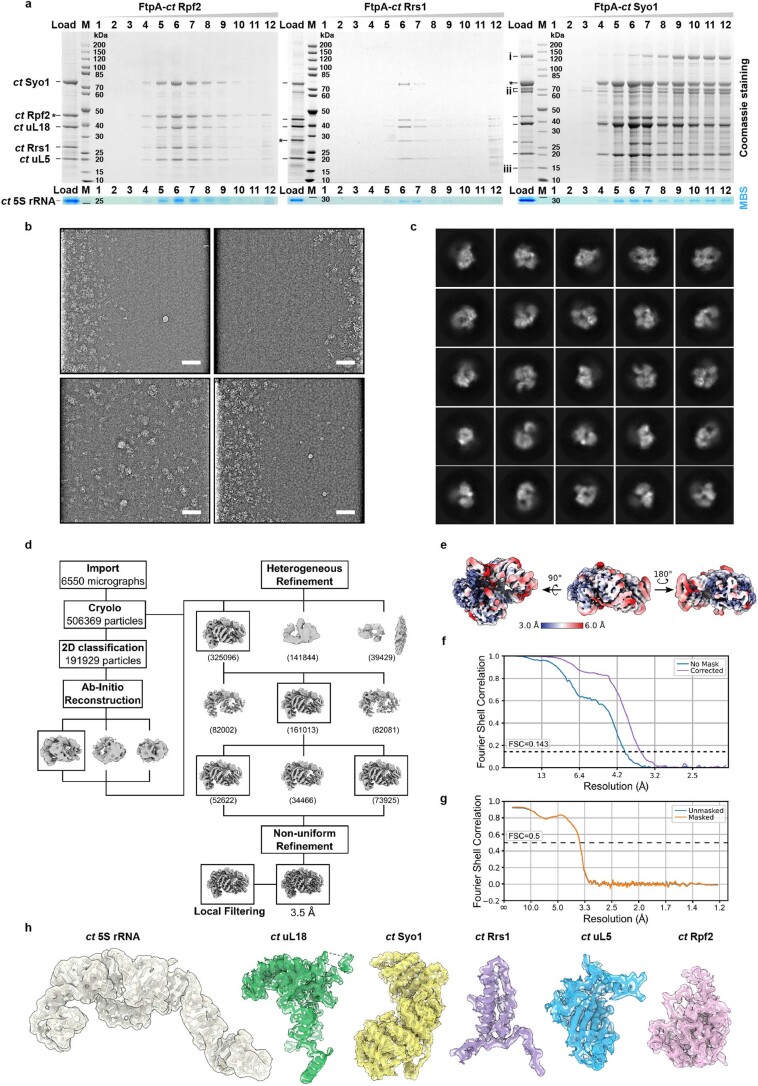
Extended Data Fig. 1. Purification and cryo-EM analysis of the hexameric 5S RNP complex isolated directly from Chaetomium thermophilum.
a, Affinity purification of FLAG-TEV-ProtA (FtpA)-tagged ctRpf2 (left), ctRrs1 (middle) and ctSyo1 (right) from C. thermophilum. The final FLAG eluates (Load) were separated by sucrose gradient centrifugation, and fractions were analyzed by SDS-PAGE. Bait proteins are labeled with asterisks. M: Molecular weight marker. The hexameric Syo1–uL18–uL5–Rpf2–Rrs1-5S rRNA pulled down by these different baits is typically recovered in fractions 6-7. A simpler Syo1–uL18–uL5-5S rRNA complex is also detected in fractions 4-5 of the FtpA-ctSyo1 purification. Presence of 5S rRNA was identified by methylene blue staining (MBS). The labeled proteins were identified by mass spectrometry: ctSyo1 (CTHT_0033460), ctRpf2 (CTHT_0061110), ctRrs1 (CTHT_0057260), ctuL18 (CTHT_0063640), and ctuL5 (CTHT_0072970); additional proteins in the FtpA-ctSyo1 purification were identified as (i) CTHT_0061210, (ii) CTHT_ 0056370 (Fpr4 homologue) and (iii) CTHT_0025560. These purifications have been done at least 3 times with similar outcome. b,c, Cryo-EM representative micrographs of the ct 5S RNP low-pass filtered to 20 Å, displayed with inverted contrast (out of 6550 micrographs used for processing) (b) and selected 2D classification averages (c). Scale bar: 50 nm. d, Cryo-EM processing scheme. The overall resolution of the final 3D reconstruction was 3.5 Å. e, Final 3D reconstruction of the ct 5S RNP filtered and colored according to local resolution. f, Fourier shell correlation (FSC) curves of the final structure showing unmasked (No mask) and masked (Corrected) FSC curves. g, Model-to-map FSC curve. h, Segmented cryo-EM densities and models of the individual subunits of the ct 5S RNP.

