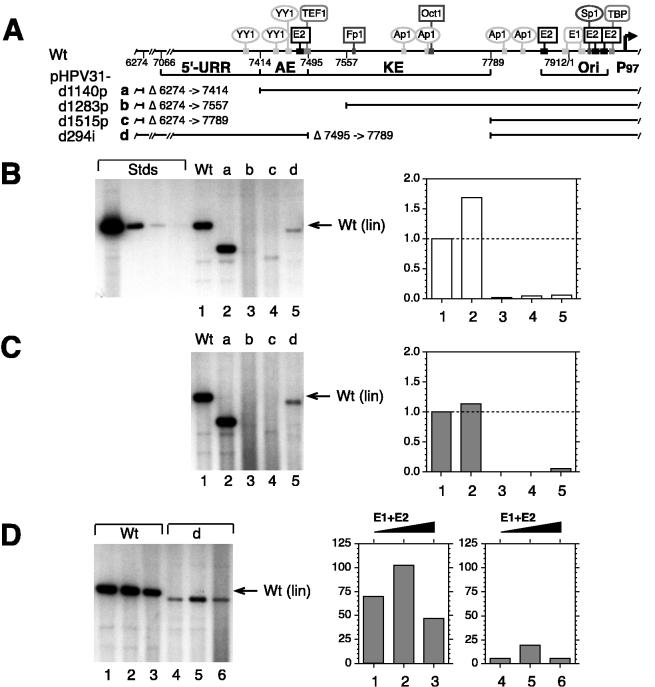
FIG. 1.
Transient DNA replication of HPV31 mutants with progressive or internal URR-deletions. (A) The schematic shows the HPV31 URR with DNA binding sites for viral and cellular factors. The positions of known URR elements, such as the 5′-URR domain, AE domain, KE element, and minimal origin of DNA replication (Ori) are indicated by brackets. Solid bars denote the retained DNA sequences, and the numbers refer to deleted nucleotide positions (described in Materials and Methods). Deletion (d) mutants of HPV31 contain progressive (p) or internal (i) URR deletions of the indicated size: a, pHPV31-d1140p (Δ6274 to 7414); b, pHPV31-d1283p (Δ6274 to 7557); c, pHPV31-d1515p (Δ6274 to 7789); and d, pHPV31-d294i (Δ7495 to 7789). (B) Autoradiogram of representative Southern blot of replicated (DpnI-resistant) viral DNAs from a transient replication assay with HPV31 wt and mutants in SCC13 cells (50% of total sample analyzed for each). Viral DNAs (equimolar amounts based on 3 μg of 7,912-bp wt HPV31) were excised from vector sequences, unimolecularly ligated, and transfected without E1 or E2 expression vectors (see Materials and Methods). DNA standards (Stds) with linearized wt HPV31, shown on the left, contain 500, 25, 2.5, and 0.5 pg of 7,912-bp DNA, respectively. The arrow on the right denotes the migration of linearized (lin) wt DNA. The graph shows the relative (to wt) replication activities, quantified from a phosphorimage of the Southern blot. Relative replication activities were comparable in four independent transfections. (C) Autoradiogram and graph from cotransfections of viral DNAs with equimolar amounts of E1 and E2 expression vectors. The graph shows relative (to wt) replication activities, quantified as described for panel B. (D) Increasing amounts of E1 and E2 expression vectors were titrated (molar ratios of expression vector to viral DNA of 0.33, 1.0, and 3.0) in the presence of constant amounts of viral wt and mutant d DNAs. Graphs show amounts of replicated DNA as a function of expression vector ratio, quantified from a phosphorimage of the Southern blot.

