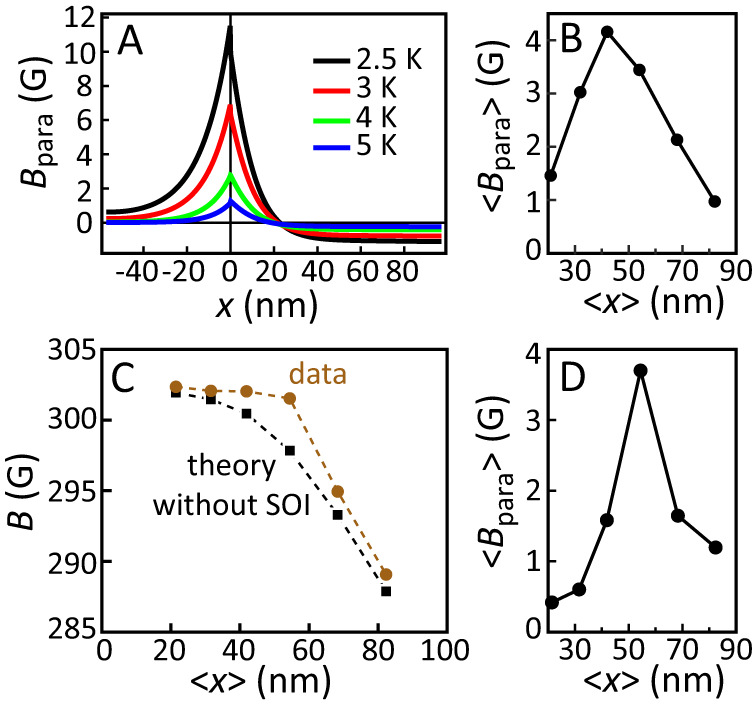
Fig. 4. Detailed analysis of the muon data of sample SM3 (see text).

A Calculated paramagnetic contribution to the response of the Pt/Nb, for various temperatures, using the full theoretical model including SO interactions and a spin Hall angle for the Pt of θ = 0.096 (see supplementary materials for more information). B Convolution of the theory curve at T = 2.5 K A with the muon stopping profiles to obtain the calculated values for its contribution to the actual muon experiment. C The predicted measurement signal in the absence of SO interactions (squares) and the measurement data (filled circles). The difference between the two is shown in D and shows the (estimated) paramagnetic contribution to our measurement signal.
