Fig. 5.

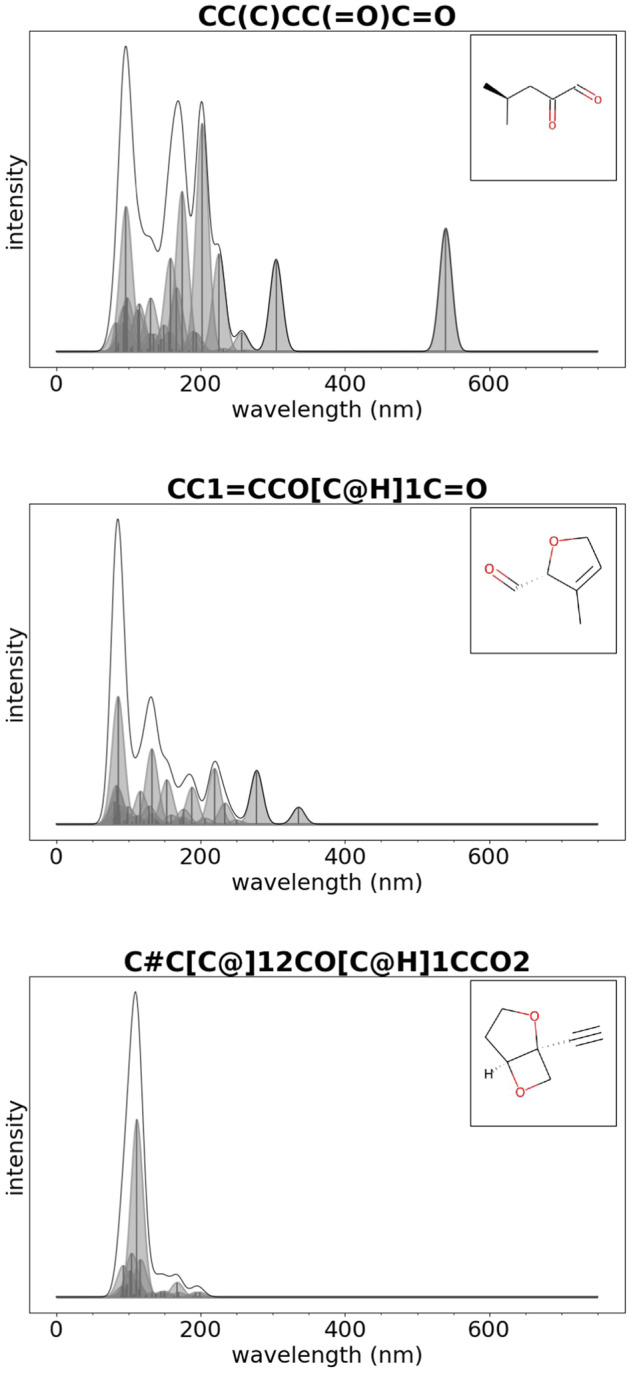
GDB-9-Ex: examples of absorption spectra for organic molecules with HOMO-LUMO gap within the range 0–2.4 eV (top), 2.4–4.0 eV (center), 4.0–20.0 eV (bottom). The title of each figure provides the SMILES representation of the molecule.

GDB-9-Ex: examples of absorption spectra for organic molecules with HOMO-LUMO gap within the range 0–2.4 eV (top), 2.4–4.0 eV (center), 4.0–20.0 eV (bottom). The title of each figure provides the SMILES representation of the molecule.