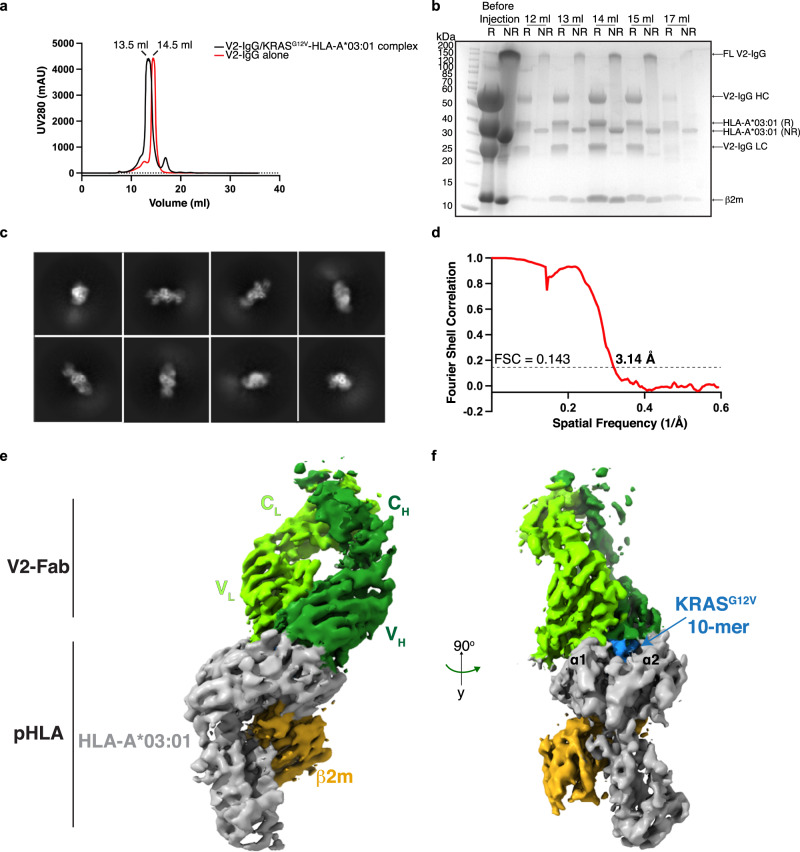
Fig. 1. 3D reconstruction of the V2-Fab/KRASG12V-HLA-A*03:01 complex.
a Size-exclusion chromatogram of the KRASG12V-HLA-A*03:01 in complex with the V2-IgG (black) overlayed with the chromatogram of the V2-IgG alone (red). Protein was monitored by absorbance at 280 nm, with an observed shift of 1 ml, proportional to the difference in molecular weight in the major peak. Retention volumes of the major peak are labeled. N > 3 independent experiments. b Coomassie-stained gradient SDS-PAGE gel of the eluted fractions at 12–17 ml from (a). R reducing 2× loading buffer, NR non reducing 2× loading buffer, HC heavy chain, LC light chain. N > 3 independent experiments. c Representative 2D classifications used for template picking. d The Fourier shell correlation (FSC) curve for the 3D reconstruction of the V2-Fab/KRASG12V-HLA-A*03:01 complex. With an FSC cutoff value of 0.143, the final resolution of the complex structure was 3.14 Å. e Cryo-EM density map of the V2-Fab/KRASG12V-HLA-A*03:01 complex at 3.14 Å. HLA-A*03:01 and β2 microglobulin (β2M) are colored in gray and gold, respectively. The V2-Fab is colored according to the heavy (dark green) and light (chartreuse) chains of the Fab fragment. f Cryo-EM map of V2-Fab/KRASG12V-HLA-A*03:01 at 90° to that shown in (e). The ten amino acid KRASG12V peptide is shown in blue between helices α1 and α2 of the HLA-A*03:01.

