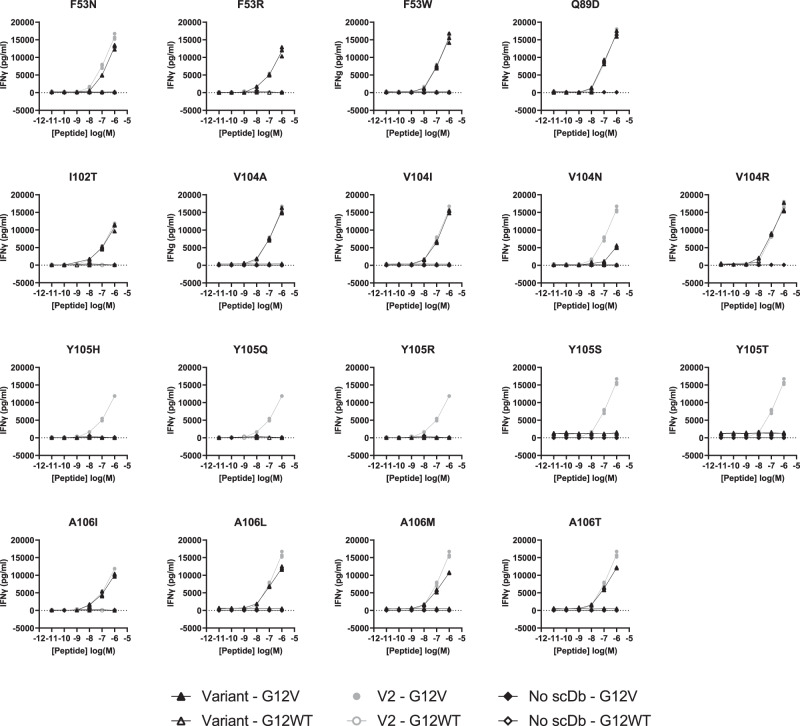
Fig. 7. Peptide pulsing co-culture assay.
V2 variants (triangles) were compared to the original V2 scDb (circle) in a peptide-pulsing co-culture with human T cells and T2A3 cells, with an E:T of 2:1 and 1 nM of scDb. T2A3 cells were pulsed with 10 µM to 10 nM of KRASG12V7–16 10mer (solid) or KRASG12WT7–16 10mer (open). After 16-20 h, cell culture supernatant was collected for detection of IFNγ by ELISA. Each variant was compared to V2 scDb in one experiment with n = 3 biologically independent samples for each co-culture condition; individual data points are plotted.

