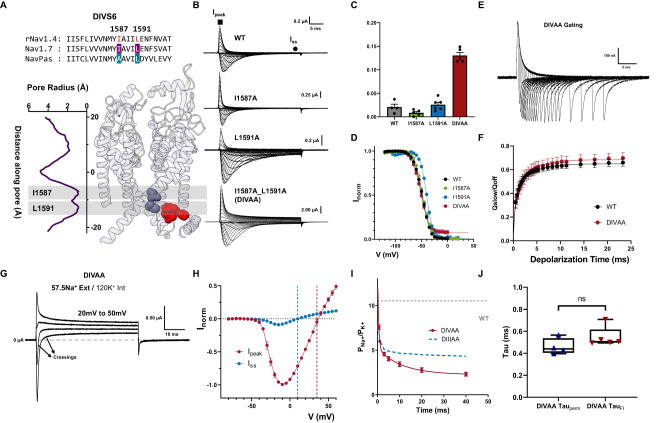
Fig. 5. Double Alanine mutations in DIV also produced a leaky inactivated state.
A Sequence alignment of DIV S6 showing identified residues (I1587 and L1591, highlighted in red) and their respective positions in the Nav1.7 structure. B Representative ionic traces for single (I1587A and L1591A) and double alanine (I1587A_L1591A—DIVAA) mutations. The ionic conditions used were 57.5 mM Na+ outside and 12 mM Na+ inside. C Ratio of steady state current (Iss) at the end of depolarization over the peak current (Ipeak) taken at +60 mV. WT, N = 4; I1587A, N = 5; L1591A, N = 6; DIVAA, N = 5. D Voltage-dependence of inactivation (h—infinity curve) for WT (black, N = 8), I1587A (green, N = 5), L1591A (blue, N = 5), and DIVAA (red, N = 8). E Representative gating current traces for charge immobilization measurements for DIVAA. F Fraction of immobilized charge vs. depolarization time for WT (black, N = 4) and DIVAA mutant (red, N = 7). G Representative ionic currents trace in bi-ionic environment. H I–V curves for the peak (red, N = 5) and steady state (blue, N = 5) current for DIVAA. The reversal potential for each component is denoted with the corresponding dashed line. I Relative Na+/K+ permeability vs. time for DIVAA (57.5 mM Na+ external and 120 mM K+ internal, N = 4). Dashed gray and blue lines show the WT and DIIIAA permeability, respectively. The solid red line represents an exponential fit to obtain the time constant. J Fast time constants for the change in selectivity (DIVAA Tauperm, N = 4) and fast inactivation time constant obtained from the ionic current at +60 mV (DIVAA TauFI, N = 5) show no significant difference (unpaired t-test with two-sided Welch’s correction, p > 0.5). The whisk shows the maxima and minima, the center shows the mean, and the box shows the 25th to 75th percentiles. Data are shown as mean ± SEM.

