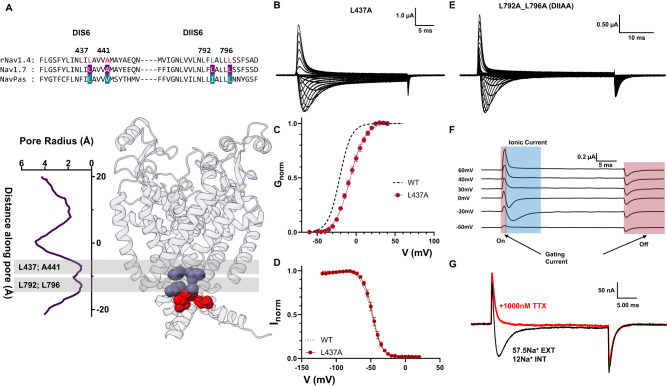
Fig. 7. Effects of alanine mutations in DI and DII S6 are different from the ones in DIII and DIV S6.
A Top: sequence alignment of DI and DII S6 showing identified residues (L437 and A441 in DI, L792 and L796 in DII, highlighted in red) and their positions in the Nav1.7 structure. B Representative ionic traces for L437A. The ionic conditions used were 57.5 mM Na+ outside and 12 mM Na+ inside. C G–V curves for WT (black dashed line, N = 4) and L437A (red, N = 8). G–V curves were calculated from the peak. D h—infinity curve for WT (black, N = 4) and L437A (red, N = 4). E Representative current traces for L792A_L796A (DIIAA). The ionic conditions used were 57.5 mM Na+ outside and 12 mM Na+ inside. F Details of DIIAA gating and ionic current components. The red and blue shadowing indicates the presence of gating and ionic currents, respectively. G Current from DIIAA collected before (black trace) and after (red) external application of TTX. Data are shown as mean ± SEM.

